
Tool Overview and worksheet
- Subject:
- Computer Science
- Engineering
- Mathematics
- Statistics and Probability
- Material Type:
- Lesson Plan
- Author:
- Emily Horan
- Date Added:
- 07/02/2019

Tool Overview and worksheet
Students will use images, U.S. Census Bureau data, and interactive maps to visualize and calculate arithmetic (population), agricultural, and physiological densities at local, regional, and national scales. They will also transfer their calculations to bar graphs.
![Big Data, Graphs, and Prediction [version 1.0]](https://oercommons.org/static/newdesign/images/materials/default-thumbnail-index.png)
In this activity, students are introduced to graphing and modeling data in a step-wise fashion. Real data of covid-19 deaths over time are used to incrementally ask students to fit the data to several models and discuss which model fits best.

There is a lot of excitement around the field of Big Data, but today we want to take a moment to look at some of the problems it creates. From questions of bias and transparency to privacy and security concerns, there is still a lot to be done to manage these problems as Big Data plays a bigger role in our lives.
Students act as R&D entrepreneurs, learning ways to research variables affecting the market of their proposed (hypothetical) products. They learn how to obtain numeric data using a variety of Internet tools and resources, sort and analyze the data using Excel and other software, and discover patterns and relationships that influence and guide decisions related to launching their products. First, student pairs research and collect pertinent consumer data, importing the data into spreadsheets. Then they clean, organize, chart and analyze the data to inform their product production and marketing plans. They calculate related statistics and gain proficiency in obtaining and finding relationships between variables, which is important in the work of engineers as well as for general technical literacy and decision-making. They summarize their work by suggesting product launch strategies and reporting their findings and conclusions in class presentations. A finding data tips handout, project/presentation grading rubric and alternative self-guided activity worksheet are provided. This activity is ideal for a high school statistics class.
Short Description:
The book includes details on how to analyze public-use data from five common national health surveys using SAS statistical software. It is an essential resource for future epidemiologists and other public health professionals!
Long Description:
National data sets provide an avenue for students to practice data analytic skills while also answering meaningful research questions. This open education resource was developed to train future public health professionals how to conduct secondary data analysis of national health surveys using SAS statistical software. SAS software was selected because it is one of the most commonly used software programs used among public health departments and academia. The book includes details on how to analyze public-use data from five common national health surveys, including the National Health Interview Survey (NHIS), Medical Expenditure Panel Survey (MEPS), Health Information National Trends Survey (HINTS), Behavior Risk Factor Surveillance System (BRFSS) and National Health and Nutrition and Examination Survey (NHANES). All datasets and corresponding syntax files are available from the Open ICPSR Data Repository.
Word Count: 43537
ISBN: 978-1-64816-003-5
(Note: This resource's metadata has been created automatically by reformatting and/or combining the information that the author initially provided as part of a bulk import process.)
This course includes basic theory and examples

Today we're going to discuss the Binomial Distribution and a special case of this distribution known as a Bernoulli Distribution. The formulas that define these distributions provide us with shortcuts for calculating the probabilities of all kinds of events that happen in everyday life. They can also be used to help us look at how probabilities are connected! For instance, knowing the chance of getting a flat tire today is useful, but knowing the likelihood of getting one this year, or in the next five years, may be more useful. And heads up, this episode is going to have a lot more equations than normal, but to sweeten the deal, we added zombies!

This textbook provides a survey of statistical methods commonly used in the life sciences, an introduction to statistical theory, and significant exposure to the statistical software package SAS 9.4. The textbook is designed for graduate students and upper division undergraduates, and assumes some familiarity with mathematical notation, functions, and algebra. No previous courses in statistics are needed. For those interested in using the software package R, programs similar in function to the SAS ones are also provided. A unique feature of this textbook is the integration of statistical procedures and theory. Most introductory texts present the statistical procedures and a mechanistic explanation of how they work, without discussing the underlying theory. Some knowledge of this theory is essential for students in the life sciences, especially graduate students, and so the textbook uses likelihood theory to explain how parameters are estimated and statistical tests derived. The statistical models for ANOVA, regression, and other common procedures are also presented. These theoretical concepts are presented in both equation and graphical form. For detailed information on the topics covered in this textbook, see the Table of Contents file in Section 1.
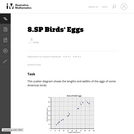
This task asks students to glean contextual information about bird eggs from a collection of measurements of said eggs organized in a scatter plot. In particular, students are asked to identify a correlation and use it to make interpolative predictions, and reason about the properties of specific eggs via the graphical presentation of the data.
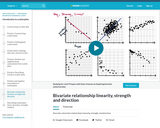
Describe a bivariate relationship's linearity, strength, and direction. In other words, plotting things that take two variables into consideration and trying to see whether there's a pattern with how they relate.
Storms can have devastating impacts on coastal communities. Typically, tropical storms like hurricanes get the most attention, but there are other types of storms that occur at more northern latitudes that can be just as destructive. For example, in January of 2018, Winter Storm Grayson caused more than 300,000 power outages and $1.1 billion in damage, and resulted in 22 confirmed casualties along the eastern seaboard. In this module, students will learn how barometric pressure changes during a storm, analyze the effect of storms on oceanographic variables, classify a storm as a bomb cyclone, and compare a bomb cyclone to a hurricane. Ultimately students will use their quantitative reasoning skills to manipulate and visualize data during storms in the northeastern United States.
(Note: this resource was added to OER Commons as part of a batch upload of over 2,200 records. If you notice an issue with the quality of the metadata, please let us know by using the 'report' button and we will flag it for consideration.)

In Bootstrap:Data Science, students form their own questions about the world around them, analyze data using multiple methods, and write a research paper about their findings. The module covers functions, looping and iteration, data visualization, linear regression, and more. Social studies, science, and business teachers can utilize this module to help students make inferences from data. Math teachers can use this module to introduce foundational concepts in statistics, and it is aligned to state and national standards.
Question In many high-grade metamorphic belts around the world, rocks were buried 20-30 km beneath the surface during deformation and metamorphism. How deep is that relative to the cruising altitude of a typical commercial airplane flying across the country?
(Note: this resource was added to OER Commons as part of a batch upload of over 2,200 records. If you notice an issue with the quality of the metadata, please let us know by using the 'report' button and we will flag it for consideration.)
Question
Over the last 70 million years or so, the Hawaiian Hot Spot has been pumping out lava, a total of about 775,000 km3 worth. As the Pacific Plate has moved over the hot spot, the volcanic peaks and plateaus of the Hawaiian-Emperor seamount chain have formed. If all of that lava had erupted in California, how deeply would California be buried in lava?
(Note: this resource was added to OER Commons as part of a batch upload of over 2,200 records. If you notice an issue with the quality of the metadata, please let us know by using the 'report' button and we will flag it for consideration.)
Question Suppose that you are building a new house. It will take about 90 kg (198 pounds) of copper to do the electrical wiring. In order to get the copper in the first place, someone needs to mine solid rock that contains copper, extract the copper minerals, throw away the waste rock, and smelt the copper minerals to produce copper metal. Rocks mined for copper typically contain only very small percentages of copper -- about 0.7% in the case of most of the big porphyry copper deposits of the world. How much rock would someone have to mine in order to extract enough copper to wire your new house?
(Note: this resource was added to OER Commons as part of a batch upload of over 2,200 records. If you notice an issue with the quality of the metadata, please let us know by using the 'report' button and we will flag it for consideration.)
Question In 1983, an eruption began at Kilauea Volcano in Hawaii that has proved to be the largest and longest-lived eruption since records began in 1823. Lava has poured out of the volcano at an average rate of about 160 million m3 per year. To put those flow rates into perspective, let's suppose that the volcano was erupting directly into your classroom. At these flow rates, how long would it take to fill your classroom with lava?
(Note: this resource was added to OER Commons as part of a batch upload of over 2,200 records. If you notice an issue with the quality of the metadata, please let us know by using the 'report' button and we will flag it for consideration.)
Question Let's suppose that you have a shoe box full of water (the box is waterproof, of course). The shoe box weighs about 9 kg (19.8 pounds). Suppose you emptied the box and filled it completely with rock (little or no air space). How much would it weigh? Let's empty the box again and fill it completely with pure gold. How much would the box weigh now?
(Note: this resource was added to OER Commons as part of a batch upload of over 2,200 records. If you notice an issue with the quality of the metadata, please let us know by using the 'report' button and we will flag it for consideration.)
This book is used in Reach Higher, Oklahoma's adult degree completion program, for a course called Data Analysis & Interpretation. It provides basic statistics that can be used for organizational data analysis by individuals with managerial professional goals, while also teaching essential skills from Microsoft Excel commonly needed for data analysis. This book uses material from Lumen Learning's Boundless Statistics (Boundless Learning) and Excel for Decision Making from University of Houston Libraries (multiple authors).
SSAC Physical Volcanology module. Students build a spreadsheet and apply the ideal gas law to model the velocity of a bubble rising in a viscous magma.
(Note: this resource was added to OER Commons as part of a batch upload of over 2,200 records. If you notice an issue with the quality of the metadata, please let us know by using the 'report' button and we will flag it for consideration.)