Updating search results...

Search Resources

1223 Results

View
Selected filters:
  • Statistics and Probability
Data Analysis
Conditional Remix & Share Permitted
CC BY-NC-SA
Rating
0.0 stars

The applet in this section allows for simple data analysis of univariate data. Users can either generate normal or uniform data for k samples or copy and paste data from another source to a text box. A univariate analysis is performed for all k samples.

Subject:
Mathematics
Statistics and Probability
Material Type:
Activity/Lab
Provider:
Consortium for the Advancement of Undergraduate Statistics Education
Provider Set:
Causeweb.org
Author:
C. Anderson-Cook, S. Dorai-Raj, T. Robinson, Virginia Tech Department of Statistics
Date Added:
02/16/2011
Data Analysis course material - VU Amsterdam
Unrestricted Use
CC BY
Rating
0.0 stars

Syllabus and Jupyter computer exercises created for the course Statistics and Data Analysis taught at the VU Amsterdam. The course is an introduction to data analysis at the BSc level and covers correlation, regression, factor analysis, cluster analysis, time series analysis and spatial analysis.

Subject:
Mathematics
Statistics and Probability
Material Type:
Full Course
Author:
Niels J. de Winter
Date Added:
08/30/2024
Data Analysis in the Psychological Sciences: A Practical, Applied, Multimedia Approach
Conditional Remix & Share Permitted
CC BY-NC-SA
Rating
0.0 stars

This open resources textbook contains 10 Units that describe and explain the main concepts in statistical analysis of psychological data (managing data, measures of central tendency, measures of spread, correlations, simple linear regression). In addition to conceptual descriptions and explanations of the basic analyses for descriptive statistics, this textbook also explains how to conduct those analyses with common statistical software (Excel) and open-source free software (R). This book is directed to undergraduates studying basic statistics, especially basic statistics in psychological research.

Subject:
Mathematics
Measurement and Data
Psychology
Social Science
Statistics and Probability
Material Type:
Textbook
Provider:
University of Iowa
Provider Set:
Iowa Research Online
Author:
J. Toby Mordkoff
Leyre Castro
Date Added:
02/02/2023
Data Analysis in the Psychological Sciences: A Practical, Applied, Multimedia Approach
Conditional Remix & Share Permitted
CC BY-NC-SA
Rating
0.0 stars

Short Description:
This open resources textbook contains 10 Units that describe and explain the main concepts in statistical analysis of psychological data. In addition to conceptual descriptions and explanations of the basic analyses for descriptive statistics, this textbook also explains how to conduct those analyses with common statistical software (Excel) and open-source free software (R).

Word Count: 27173

(Note: This resource's metadata has been created automatically by reformatting and/or combining the information that the author initially provided as part of a bulk import process.)

Subject:
Applied Science
Mathematics
Statistics and Probability
Material Type:
Textbook
Provider:
University of Iowa
Date Added:
01/16/2023
Data Analytics and Decision Making
Unrestricted Use
CC BY
Rating
0.0 stars

Short Description:
Data analytics is a rapidly evolving field. In today's labour market, knowing how to acquire, process, and interpret large amounts of data to make optimal decisions is crucial for many professionals, especially those in business and engineering. This open textbook, "a new online course" if you will, focuses on three key concept areas: data acquisition, data processing, and decision-making models. In this course, students will be able to develop advanced knowledge and skills to acquire related data for operations of business or projects; apply quantitative literacy skills such as statistics and machine learning; and use predictive or prescriptive modeling to make timely, actionable, and meaningful decisions.

Long Description:
Data analytics is a rapidly evolving field. In today’s labour market, knowing how to acquire, process, and interpret large amounts of data to make optimal decisions is crucial for many professionals, especially those in business and engineering. This open textbook, “a new online course” if you will, focuses on three key concept areas: data acquisition, data processing, and decision-making models. In this course, students will be able to develop advanced knowledge and skills to acquire related data for operations of business or projects; apply quantitative literacy skills such as statistics and machine learning; and use predictive or prescriptive modeling to make timely, actionable, and meaningful decisions.

Word Count: 2038

(Note: This resource's metadata has been created automatically by reformatting and/or combining the information that the author initially provided as part of a bulk import process.)

Subject:
Applied Science
Business and Communication
Computer Science
Engineering
Information Science
Management
Mathematics
Statistics and Probability
Material Type:
Textbook
Provider:
University of Windsor
Date Added:
02/28/2022
Data Science: A First Introduction with Python
Conditional Remix & Share Permitted
CC BY-NC-SA
Rating
0.0 stars

This is a textbook for teaching data science using the Python programming language at a general first year undergraduate level.

Subject:
Mathematics
Measurement and Data
Statistics and Probability
Material Type:
Textbook
Author:
Joel Ostblom
Lindsey Heagy
Melissa Lee
Tiffany Timbers
Trevor Campbell
Date Added:
04/02/2024
Data Science Lessons Grades 6-10
Unrestricted Use
CC BY
Rating
0.0 stars

This page shares five units of youcubed lessons for grades 6-10 that introduce students (and teachers) to data science. The units start with an introduction to the concept of data and move to lessons that invite students to explore their own data sets. These lessons teach important content through a pattern-seeking, exploratory approach, and are designed to engage students actively.


Data Science LessonsThis page shares five units of youcubed lessons for grades 6-10 that introduce students (and teachers) to data science. The units start with an introduction to the concept of data and move to lessons that invite students to explore their own data sets.  These lessons teach important content through a pattern-seeking, exploratory approach, and are designed to engage students actively. The culminating unit is a citizen science project that gives students an opportunity to conduct a data inquiry. The lessons accompany a new online course for teachers, where some of the lessons are featured, along with other lesson ideas. These lessons are offered with ideas for in-person or online teaching, and can be taught at any time of year.


LessonsTeacher Online Course: 21st Century Teaching and LearningUnit 1: Data Is EverywhereUnit 2: Working With Data Analysis ToolsUnit 3: Measures of Center & SpreadUnit 4: Understanding VariabilityUnit 5: A Community Data Collection Project

ResourcesHigh School Data Science CourseCODAPWhat's Going On In This Graph?Data Science Initiative VideoThe Data Science K-12 MovementData Talks


Cool Extras


What are Data Talks?


A Picture Book Introduction to Data Science


Measures of Center and Spread Animated Movies


Stanford News Press Release

Subject:
Applied Science
Mathematics
Measurement and Data
Statistics and Probability
Material Type:
Full Course
Author:
YouCubed
Date Added:
09/23/2020
Data Stories
Only Sharing Permitted
CC BY-NC-ND
Rating
0.0 stars

The goal of the Data4Kids project is to help educators prepare children to be better data users, stewards, and consumers. With support from the South Big Data Hub, the Urban Institute and its partners have created a set of tools and resources to help teach kids in primary and secondary schools about data, data science, and data visualization in a virtual environment.

These "Data Stories" are designed to assist educators in supporting students’ data science learning, and can be allow educators to freely used across a variety of grades. Each story is a starter kit for educators at different levels–grades 3-5 (Band 1); grades 6-8 (Band 2); or grades 9-12 (Band 3).

Each Data Story includes an Instructor's Guide, Data (available in Microsoft Excel, CSV, and Google Sheets formats), a Data Dictionary to describe the data values in each story (available in Microsoft Word and Google Doc formats), and Teaching Slides (available in Microsoft PowerPoint and Google Slides formats).

Subject:
Mathematics
Statistics and Probability
Material Type:
Activity/Lab
Data Set
Lesson Plan
Author:
Urban Institute
Date Added:
04/21/2023
Data Talks Archives
Unrestricted Use
CC BY
Rating
0.0 stars

Data talks are short 5-10 minute classroom discussions to help students develop data literacy. This pedagogical strategy is similar in structure to a number talk, but instead of numbers students are shown a data visual and asked what interests them.

Subject:
Applied Science
Mathematics
Measurement and Data
Statistics and Probability
Material Type:
Teaching/Learning Strategy
Author:
YouCubed
Date Added:
09/23/2020
Data Wrangling with R
Conditional Remix & Share Permitted
CC BY-NC-SA
Rating
0.0 stars

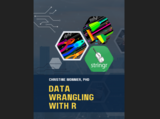
Cleaning, reshaping, and transforming data for analysis and visualization, with R and the Tidyverse

Word Count: 3515

(Note: This resource's metadata has been created automatically by reformatting and/or combining the information that the author initially provided as part of a bulk import process.)

Subject:
Applied Science
Computer Science
Information Science
Mathematics
Social Science
Sociology
Statistics and Probability
Material Type:
Textbook
Provider:
College of DuPage Press, 2022
Author:
Christine Monnier
Date Added:
07/13/2022
Decibels and Acoustical Engineering
Read the Fine Print
Educational Use
Rating
0.0 stars

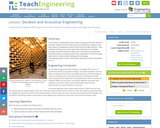
In this lesson, students learn that sound is energy and has the ability to do work. Students discover that sound is produced by a vibration and they observe soundwaves and how they travel through mediums. They understand that sound can be absorbed, reflected or transmitted. Through associated activities, videos and a PowerPoint presentation led by the teacher, students further their exploration of sound through discussions in order to build background knowledge.

Subject:
Applied Science
Engineering
Mathematics
Measurement and Data
Physical Science
Statistics and Probability
Material Type:
Lesson
Provider:
TeachEngineering
Provider Set:
Lessons
Author:
Emma Cipriani
Geanna Schwaegerle
La’Nise Gray
Natalie Jackson
Date Added:
03/01/2019
Deciding on which statistics to use.
Conditional Remix & Share Permitted
CC BY-NC-SA
Rating
0.0 stars

This chart will help you identify which statistical analysis to used depending on your research question.How to use: When deciding which statistics to use, first you must ask what is your research question looking for (difference or association). Then, identify what type of variable are you dealing with (Nominal, Ordinal, or Interval / Ratio), then the number of independent variables (IV) or dependent variables (DV) depending on the nature of your hypothesis. Below is a chart to help you identify which analysis to use for your hypothesis testing. 

Subject:
Statistics and Probability
Material Type:
Module
Author:
Antoniette Aizon
Date Added:
04/11/2018
Decision Making Under Uncertainty: Introduction to Structured Expert Judgment
Conditional Remix & Share Permitted
CC BY-NC-SA
Rating
0.0 stars

In an increasingly data-driven world, data and its use aren’t always all it’s cracked up to be. This course aims to address the critical lack of any or appropriate data in many areas where complex decisions need to be made.

For instance, how can you predict volcano activity when no eruptions have been recorded over a long period of time? Or how can you predict how many people will be resistant to antibiotics in a country where there is no available data at national level? Or how about estimating the time needed to evacuate people in flood risk areas?

In situations like these, expert opinions are needed to address complex decision-making problems. This course, aimed at researchers and professionals from any academic background, will show you how expert opinion can be used for uncertainty quantification in a rigorous manner.

Various techniques are used in practice. They vary from the informal and undocumented opinion of one expert to a fully documented and formal elicitation of a panel of experts, whose uncertainty assessments can be aggregated to provide support for complex decision making.

In this course you will be introduced to state-of-the-art expert judgment methods, particularly the Classical Model (CM) or Cooke’s method, which is arguably the most rigorous method for performing Structured Expert Judgment.

CM, developed at TU Delft by Roger Cooke, has been successfully applied for over 30 years in areas as diverse as climate change, disaster management, epidemiology, public and global health, ecology, aeronautics/aerospace, nuclear safety, environment and ecology, engineering and many others.
Subject:
Applied Science
Engineering
Mathematics
Statistics and Probability
Material Type:
Full Course
Provider:
Delft University of Technology
Provider Set:
TU Delft OpenCourseWare
Author:
Dr. A.M. Hanea
Dr. ir. G.F. Nane
Prof. dr. R.M. Cooke
Date Added:
02/14/2020
Deciviews from Look Rock, Great Smoky Mountains National Park: How Hazy is it?
Conditional Remix & Share Permitted
CC BY-NC-SA
Rating
0.0 stars

Spreadsheets Across the Curriculum/Geology of National Parks module. Students calculate the haze index and standard visual range from concentrations of particulate matter.

(Note: this resource was added to OER Commons as part of a batch upload of over 2,200 records. If you notice an issue with the quality of the metadata, please let us know by using the 'report' button and we will flag it for consideration.)

Subject:
Atmospheric Science
Biology
Life Science
Mathematics
Measurement and Data
Physical Science
Statistics and Probability
Material Type:
Activity/Lab
Provider:
Science Education Resource Center (SERC) at Carleton College
Provider Set:
Teach the Earth
Date Added:
07/31/2020
Degrees of Freedom and Effect Sizes: Crash Course Statistics #28
Read the Fine Print
Some Rights Reserved
Rating
0.0 stars

Today we're going to talk about degrees of freedom - which are the number of independent pieces of information that make up our models. More degrees of freedom typically mean more concrete results. But something that is statistically significant isn't always practically significant. And to measure that, we'll introduce another new concept - effect size.

Subject:
Mathematics
Statistics and Probability
Material Type:
Lecture
Provider:
Complexly
Provider Set:
Crash Course Statistics
Date Added:
08/22/2018
Delta environments and paleogeography
Conditional Remix & Share Permitted
CC BY-NC-SA
Rating
0.0 stars

Students are given 4 hypothetical stratigraphic columns (each roughly 30 m thick) of deltaic deposits, 3 base maps with section locations, and a map scale. Students subdivide the stratigraphic units into subfacies and interpret subenvironments (delta plain, delta front, prodelta, marine) and describe/list features used to make these interpretations. Using depositional interpretations, 3 bentonite marker beds, and paleocurrent information, students draw 3 successive paleogeographic maps of the region showing delta migration through time.

(Note: this resource was added to OER Commons as part of a batch upload of over 2,200 records. If you notice an issue with the quality of the metadata, please let us know by using the 'report' button and we will flag it for consideration.)

Subject:
Biology
Life Science
Mathematics
Measurement and Data
Statistics and Probability
Material Type:
Activity/Lab
Provider:
Science Education Resource Center (SERC) at Carleton College
Provider Set:
Teach the Earth
Author:
Maya Elrick
Date Added:
08/10/2019
Demographic Trends and Problems of the Modern World
Conditional Remix & Share Permitted
CC BY-NC-SA
Rating
0.0 stars

The study of populations and demographics is explained in detail in this introductory series by Professor David Coleman, Professor of Demography. Using statistics gathered from censuses, parish records and other sources, Professor Coleman looks at the ways in which populations rise and fall through history. This series is at an introductory level and individuals need no prior knowledge of analyzing statistics or mathematics.

Subject:
Mathematics
Statistics and Probability
Material Type:
Lecture
Lecture Notes
Provider:
University of Oxford
Provider Set:
University of Oxford Podcasts
Author:
David Coleman
Date Added:
04/26/2012
Demonstration of radioactive decay using pennies
Conditional Remix & Share Permitted
CC BY-NC-SA
Rating
0.0 stars

A demonstration (with full class participation) to illustrate radioactive decay by flipping coins. Shows students visually the concepts of exponential decay, half-life and randomness. Works best in large classes -- the more people, the better.

(Note: this resource was added to OER Commons as part of a batch upload of over 2,200 records. If you notice an issue with the quality of the metadata, please let us know by using the 'report' button and we will flag it for consideration.)

Subject:
Biology
Geology
Geoscience
Life Science
Mathematics
Measurement and Data
Physical Science
Statistics and Probability
Material Type:
Simulation
Provider:
Science Education Resource Center (SERC) at Carleton College
Provider Set:
Teach the Earth
Author:
Jennifer Wenner
Date Added:
08/25/2019
Density of Earth - Using Some Field Data
Conditional Remix & Share Permitted
CC BY-NC-SA
Rating
0.0 stars

This module addresses the problem of how to determine the density of the earth and has students do some field experiments to get the data they need to answer the problem.

(Note: this resource was added to OER Commons as part of a batch upload of over 2,200 records. If you notice an issue with the quality of the metadata, please let us know by using the 'report' button and we will flag it for consideration.)

Subject:
Biology
Geoscience
Life Science
Mathematics
Measurement and Data
Physical Science
Physics
Statistics and Probability
Material Type:
Activity/Lab
Provider:
Science Education Resource Center (SERC) at Carleton College
Provider Set:
Teach the Earth
Author:
Len Vacher
Date Added:
09/05/2019