Updating search results...

High School Climate Education

This is a curated collection of resources that aim to teach about Earth's climate for high school students. 

903 affiliated resources

Search Resources

View
Selected filters:
Seasonal Climate Forecast Serves as a Call to Action
Read the Fine Print
Rating
0.0 stars

Faced with an increased chance for heavy precipitation and flooding, an emergency manager in Oregon spread the word, encouraging groups to be prepared.

Subject:
Atmospheric Science
Physical Science
Material Type:
Case Study
Provider:
National Oceanic and Atmospheric Administration
Provider Set:
U.S. Climate Resilience Toolkit
Date Added:
08/29/2016
Seasons and Ecliptic Simulator
Unrestricted Use
CC BY
Rating
0.0 stars

An interactive simulation of Earth's seasonal dynamics that includes the axial tilt and other aspects of Earth's annual cycle. This is part of a larger lab from the University of Nebraska at Lincoln: http://astro.unl.edu/naap/motion1/motion1.html

Subject:
Applied Science
Career and Technical Education
Environmental Science
Environmental Studies
Physical Science
Material Type:
Simulation
Provider:
CLEAN: Climate Literacy and Energy Awareness Network
Provider Set:
CLEAN: Climate Literacy and Energy Awareness Network
Author:
The Nebraska Astronomy Applet Project
University of Nebraska
Date Added:
06/19/2012
The Second Solution: Riparian Restoration
Read the Fine Print
Rating
0.0 stars

This video illustrates how one community developed and implemented a sustainable solution to help keep stream water cool enough for healthy fish. Their solution has the added benefit of removing CO2 from the atmosphere.

Subject:
Applied Science
Career and Technical Education
Environmental Science
Environmental Studies
Geoscience
Physical Science
Provider:
CLEAN: Climate Literacy and Energy Awareness Network
Provider Set:
CLEAN: Climate Literacy and Energy Awareness Network
Author:
Climate Solutions
Northwest Biocarbon Initiative
Date Added:
10/27/2014
Secrets of the Sediments - Digital Adaptation
Conditional Remix & Share Permitted
CC BY-NC-SA
Rating
0.0 stars

This activity is a Google Slide playlist. Students will analyze data from sediments collected off the coast of Santa Barbara, California to determine whether this information can be used to study historical climate change. This playlist is suitable for use in remote, hybrid, or in-person instruction and can easily be added to a Learning Management System.


Provenance: Molly Ludwick, Kings Mountain Middle School
Reuse: This item is offered under a Creative Commons Attribution-NonCommercial-ShareAlike license http://creativecommons.org/licenses/by-nc-sa/3.0/ You may reuse this item for non-commercial purposes as long as you provide attribution and offer any derivative works under a similar license.

(Note: this resource was added to OER Commons as part of a batch upload of over 2,200 records. If you notice an issue with the quality of the metadata, please let us know by using the 'report' button and we will flag it for consideration.)

Subject:
Applied Science
Biology
Environmental Science
Information Science
Life Science
Oceanography
Physical Science
Material Type:
Activity/Lab
Provider:
Science Education Resource Center (SERC) at Carleton College
Provider Set:
Teach the Earth
Author:
Beverly Owens
Molly Ludwick
Date Added:
08/07/2022
Sentinel-2 10-Meter Land Use/Land Cover: Exploring change in the new 2017–2021 time-series
Unrestricted Use
CC BY
Rating
0.0 stars

The Sentinel-2 10m Land Use/Land Cover time-series is live on ArcGIS Living Atlas of the World! This map provides an annual assessment of yearly global land cover from 2017–2021, in 9 different land cover classes, at 10-meter resolution. The new time-series animates the natural and anthropogenic processes that continue to transform our planet's landscapes and resources, giving researchers, planners, and the GIS community the information they need to make critical future decisions.

Subject:
Physical Geography
Physical Science
Material Type:
Data Set
Reading
Author:
Craig McCabe
Date Added:
03/07/2022
Shine - Mini climate change musical
Read the Fine Print
Rating
0.0 stars

This learning activity is a climate change musical for K-12, youth groups or faith organizations. Shine weaves together climate science and performance art into a fun and powerful story, which spans 300 million years of geological time to convey how humanity, energy, and climate are interrelated.

Subject:
Applied Science
Career and Technical Education
Environmental Science
Environmental Studies
Physical Science
Material Type:
Activity/Lab
Provider:
CLEAN: Climate Literacy and Energy Awareness Network
Provider Set:
CLEAN: Climate Literacy and Energy Awareness Network
Author:
Beth Osnes
Inside the Greenhouse
Shira Dickler
Date Added:
09/24/2018
Shopping Mall Exhibit Raises Awareness of Sea Level Rise
Read the Fine Print
Rating
0.0 stars

Residents along the U.S. Gulf Coast are familiar with the flooding hazards associated with storms, yet many are unaware of the risk of sea level rise. Shoppers at a local mall had a chance to explore the potential impacts of sea level rise on their communities.

Subject:
Applied Science
Environmental Science
Material Type:
Case Study
Provider:
National Oceanic and Atmospheric Administration
Provider Set:
U.S. Climate Resilience Toolkit
Date Added:
08/29/2016
Show Don't Tell: Visualizing Sea Level Rise to Set Planning Priorities
Read the Fine Print
Rating
0.0 stars

City officials in Tybee Island, Georgia, recognized sea level rise as a growing problem for their community. Visualizations from a sea level rise viewer helped them raise awareness of the city's vulnerabilities and led to development of Georgia’s first sea level rise plan.

Subject:
Applied Science
Environmental Science
Material Type:
Case Study
Provider:
National Oceanic and Atmospheric Administration
Provider Set:
U.S. Climate Resilience Toolkit
Date Added:
09/29/2016
Show Your Stripes - Changes in Temperature
Read the Fine Print
Educational Use
Rating
0.0 stars

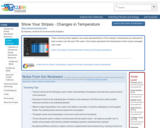
These 'warming stripe' graphics are visual representations of the change in temperature as measured in each country over the past 100+ years. Each stripe represents the temperature in that country averaged over a year.

Subject:
Physical Science
Material Type:
Reading
Provider:
CLEAN: Climate Literacy and Energy Awareness Network
Provider Set:
CLEAN: Climate Literacy and Energy Awareness Network
Author:
Ed Hawkins
Institute for Environmental Analytics
Date Added:
07/07/2021
Shrinking Forest - Growing Problem
Read the Fine Print
Educational Use
Rating
0.0 stars

This activity guides users through a series of steps for measuring land use change in the Amazon rainforest in Brazil in three different years. Using Synthetic Aperture Radar (SAR) images students calculate how much of the area is forested and how much is deforested in each year by processing and measuring the images using ImageJ, a public-domain image analysis program. The final product of this chapter is an image showing, in color, the oldest to most recently deforested areas.

Subject:
Physical Science
Material Type:
Activity/Lab
Provider:
CLEAN: Climate Literacy and Energy Awareness Network
Provider Set:
CLEAN: Climate Literacy and Energy Awareness Network
Date Added:
04/26/2017
Shrinking Glaciers: A Chronology of Climate Change
Read the Fine Print
Rating
0.0 stars

This video features scientists in New Zealand's Southern Alps, examining samples from the rocky landscape once dominated by glaciers. Their research, combined with other climate records, has revealed a link between glacial retreat and rising levels of carbon dioxide in the air.

Subject:
Applied Science
Career and Technical Education
Environmental Science
Environmental Studies
Physical Science
Provider:
CLEAN: Climate Literacy and Energy Awareness Network
Provider Set:
CLEAN: Climate Literacy and Energy Awareness Network
Author:
American Museum of Natural History
Date Added:
09/24/2018
Sick Planet: The Link between Carbon, Climate Change, and Human Health
Read the Fine Print
Educational Use
Rating
0.0 stars

Our bodies are finely-calibrated, organic machines that are capable of dealing with the fluctuations of our internal systems in response to stimuli. We are able to regulate these changes through feedback loops in order to maintain the self in a prime ‘operating condition’ known as homeostasis. While deviations from homeostasis may occur, the body has processes in place to eventually return to normal. Long term or highly disruptive deviation, to the point where the body’s natural feedback loops are insufficient at correcting the error, is an indicator of something abnormal at work—be it parasite, virus, or organ malfunction.

The Earth also displays similar mechanisms of homeostasis—complex feedback loops that allow it to regulate temperature, gas concentrations, and pH. Normally, small fluctuations are regulated within the system. Negative feedback loops maintain balance through chemical processes like the sink and release of carbon gases. However, as excessive fossil fuel combustion tips the scales, it is likely that we are moving further away from the point where these feedback loops are enough to return the carbon cycle to balance.

We can see symptoms of this deviation in alteration of the climate, increased warming, and the thawing of glaciers and permafrost. The study of these indicators allow us to monitor the disease and provide insight into the underlying cause. The feedback loops found in the carbon cycle are unable to rectify the anthropogenic carbon output post Industrial revolution, leading to some alarming trends. The greater the divergence from normal the greater the impact these indicators have on the system of the planet until, like the human body, there is irreparable harm to the system.

Is this warming a fever-- a planetary self-preservation system precipitated by the intemperate combustion of fossil fuels-- that aims to overcorrect the problem before returning to homeostasis in the geological timeline? How does a ‘sick’ planet impact our own health? This unit addresses the consequence of anthropogenic carbon sourced global warming on the planetary system and human physiology.
Subject:
Applied Science
Biology
Ecology
Environmental Science
Life Science
Material Type:
Lesson Plan
Unit of Study
Provider:
Yale-New Haven Teachers Institute
Provider Set:
2021 Curriculum Units Volume III
Date Added:
08/01/2021
Snowpack: Decadal Averages Map
Read the Fine Print
Rating
0.0 stars

This is an interactive map of California and the Sierra Nevada mountains, showing how the amount of water stored in the snowpack will vary under different climate scenarios. The tool shows observations and projections from 1950 to 2090, and uses low or high emission scenarios to model future snowpack. The tool can be adjusted to show different months of the year and various climate models, graphed by site.

Subject:
Applied Science
Atmospheric Science
Career and Technical Education
Environmental Science
Environmental Studies
Physical Science
Provider:
CLEAN: Climate Literacy and Energy Awareness Network
Provider Set:
CLEAN: Climate Literacy and Energy Awareness Network
Author:
California Energy Commission
Date Added:
09/24/2018
The Social Cost of Carbon
Read the Fine Print
Educational Use
Rating
0.0 stars

With the help of two climate experts, this video discusses how the social cost of carbon is calculated, how it should, perhaps, be calculated, and why the effort to quantify this value is necessary despite its imperfections.

Subject:
Applied Science
Career and Technical Education
Economics
Environmental Science
Environmental Studies
Physical Science
Political Science
Social Science
Material Type:
Diagram/Illustration
Reading
Provider:
CLEAN: Climate Literacy and Energy Awareness Network
Provider Set:
CLEAN: Climate Literacy and Energy Awareness Network
Author:
Climate Now
Date Added:
07/25/2022
Soil Microbes and Global Warming
Read the Fine Print
Educational Use
Rating
0.0 stars

In this video, adapted from KUAC-TV and the Geophysical Institute at the University of Alaska, Fairbanks, viewers learn how one-celled organisms in permafrost may be contributing to greenhouse gas levels and global warming.

Subject:
Applied Science
Biology
Career and Technical Education
Chemistry
Environmental Science
Environmental Studies
Geology
Life Science
Physical Science
Material Type:
Diagram/Illustration
Reading
Provider:
CLEAN: Climate Literacy and Energy Awareness Network
Provider Set:
CLEAN: Climate Literacy and Energy Awareness Network
Author:
KUAC
Teachers' Domain
WGBH Educational Foundation
Date Added:
05/15/2012
Solar House
Read the Fine Print
Educational Use
Rating
0.0 stars

This video segment from 'What's Up in the Environment,' shares how an entire home can be constructed using green energy sources (solar and geothermal energy). Video is narrated by young boy whose father is the chief engineer on the project.

Subject:
Applied Science
Career and Technical Education
Environmental Science
Environmental Studies
Physical Science
Material Type:
Diagram/Illustration
Reading
Provider:
CLEAN: Climate Literacy and Energy Awareness Network
Provider Set:
CLEAN: Climate Literacy and Energy Awareness Network
Author:
Teachers' Domain
Thirteen/WNET.org
Date Added:
05/15/2012
Solar Structures
Read the Fine Print
Educational Use
Rating
0.0 stars

This activity explores solar energy and the difference between passive and active solar design. Students will design and build a solar structure in order to test how radiation and conduction distribute heat.

Subject:
Applied Science
Career and Technical Education
Environmental Science
Environmental Studies
Physical Science
Material Type:
Activity/Lab
Provider:
CLEAN: Climate Literacy and Energy Awareness Network
Provider Set:
CLEAN: Climate Literacy and Energy Awareness Network
Author:
Institute of Electrical and Electronics Engineers
Try Engineering
Date Added:
06/29/2022
Solar Water Heater
Read the Fine Print
Some Rights Reserved
Rating
0.0 stars

Student teams design and build solar water heating devices that mimic those used in residences to capture energy in the form of solar radiation and convert it to thermal energy. In this activity, students gain a better understanding of the three different types of heat transfer, each of which plays a role in the solar water heater design. Once the model devices are constructed, students perform efficiency calculations and compare designs.

Subject:
Applied Science
Environmental Science
Physical Science
Physics
Material Type:
Activity/Lab
Provider:
CLEAN: Climate Literacy and Energy Awareness Network
Provider Set:
CLEAN: Climate Literacy and Energy Awareness Network
Author:
Denise W. Carlson
Landon B. Gennetten
Lauren Cooper
Malinda Schaefer Zarske
TeachEngineering from Integrated Teaching and Learning Program
Date Added:
06/19/2012
Solving the Carbon Dioxide Problem
Read the Fine Print
Educational Use
Rating
0.0 stars

Students use information from Project Drawdown to learn about the sectors where climate solutions are being implemented to help slow down climate warming. Students construct a plan for using specific solutions to reduce and remove the amount of carbon dioxide in the atmosphere, and make a claim describing how their plan could work to keep global temperature change below 1.5 ÂC.

Subject:
Applied Science
Career and Technical Education
Environmental Science
Environmental Studies
Physical Science
Material Type:
Activity/Lab
Provider:
CLEAN: Climate Literacy and Energy Awareness Network
Provider Set:
CLEAN: Climate Literacy and Energy Awareness Network
Author:
Melissa Rummel
University Corporation for Atmospheric Research Center for Science Education
Date Added:
06/27/2022
Southern Great Plains and Southwest | Global Weirding
Read the Fine Print
Educational Use
Rating
0.0 stars

This video discusses impacts that the Midwestern US is experiencing due to climate change. It describes how climate change is affecting agriculture, tourism, drought and flood, water cycles and freshwater availability, the spread of invasive species and disease, as well as other topics.

Subject:
Applied Science
Atmospheric Science
Career and Technical Education
Economics
Environmental Science
Environmental Studies
Physical Science
Social Science
Material Type:
Diagram/Illustration
Reading
Provider:
CLEAN: Climate Literacy and Energy Awareness Network
Provider Set:
CLEAN: Climate Literacy and Energy Awareness Network
Author:
Global Weirding Series
Katharine Hayhoe
Date Added:
06/25/2019