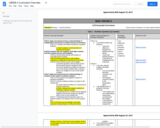
6th Grade Regular Math: Course Scope & Sequence.
- Subject:
- Mathematics
- Material Type:
- Full Course
- Provider:
- Liberty Public Schools
- Date Added:
- 08/15/2017

6th Grade Regular Math: Course Scope & Sequence.
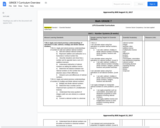
7th Grade Regular Math: Course Scope & Sequence.
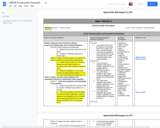
8th Grade Regular Math: Course Scope & Sequence.
Description:
This is the online, interactive version of OpenIntro's Advanced High School Statistics (https://www.openintro.org/book/ahss/). It was developed by Emiliano Vega and Ralf Youtz of Portland Community College using PreTeXt.
Advanced High School Statistics covers a first course in statistics, providing an introduction to applied statistics that is clear, concise, and accessible. This book was written to align with the AP© Statistics Course Description, but it's also popular in non-AP courses and community colleges.
We hope readers will take away three ideas from this book in addition to forming a foundation of statistical thinking and methods:
1. Statistics is an applied field with a wide range of practical applications.
2. You don't have to be a math guru to learn from real, interesting data.
3. Data are messy, and statistical tools are imperfect. But, when you understand the strengths and weaknesses of these tools, you can use them to learn about the real world.
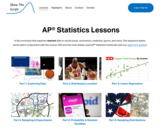
A full AP® Statistics curriculum that explores relevant data in social issues, economics, medicine, sports, and more. The sequence works well in conjunction with the course CED and the most widely-used AP® Statistics textbooks.
This resource can be used in providing real-life activity for students by conducting survey. Results of their survey will be organized and presented through text, graphs and tables with research ethics observed.

This resource is a video abstract of a research paper created by Research Square on behalf of its authors. It provides a synopsis that's easy to understand, and can be used to introduce the topics it covers to students, researchers, and the general public. The video's transcript is also provided in full, with a portion provided below for preview:
"Many microbiome studies have matched-pair or matched-set designs, in which data naturally cluster into sets, with some within-set variation in traits of interest. Statistical methods help us make sense of these data, testing hypotheses at the community or operational taxonomic unit (OTU) level. Now, researchers present a new strategy for analyzing matched-set microbial data. The method can be used with both PERMANOVA, a commonly used distance-based method for testing hypotheses at the community level, and the linear decomposition model (LDM), which unifies the community-level and OTU-level tests into one framework. An indicator variable for each set is included as a covariate to constrain comparisons between samples within a set. Simulations using this method showed that the strategy outperformed alternative strategies in a wide range of scenarios, and the flexibility of these methods to allow discrete or continuous traits or interactions to be tested was illustrated with analysis of two real datasets..."
The rest of the transcript, along with a link to the research itself, is available on the resource itself.
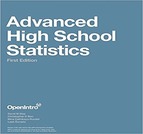
This textbook is part of the OpenIntro Statistics series and offers complete coverage of the high school AP Statistics curriculum. Real data and plenty of inline examples and exercises make this an engaging and readable book. Links to lecture slides, video overviews, calculator tutorials, and video solutions to selected end of chapter exercises make this an ideal choice for any high school or Community College teacher. In fact, Portland Community College recently adopted this textbook for its Introductory Statistics course, and it estimates that this will save their students $250,000 per year. Find out more at: openintro.org/ahss
View our video tutorials here:
openintro.org/casio
openintro.org/TI
Students build a formal understanding of probability, considering complex events such as unions, intersections, and complements as well as the concept of independence and conditional probability. The idea of using a smooth curve to model a data distribution is introduced along with using tables and technology to find areas under a normal curve. Students make inferences and justify conclusions from sample surveys, experiments, and observational studies. Data is used from random samples to estimate a population mean or proportion. Students calculate margin of error and interpret it in context. Given data from a statistical experiment, students use simulation to create a randomization distribution and use it to determine if there is a significant difference between two treatments.
Find the rest of the EngageNY Mathematics resources at https://archive.org/details/engageny-mathematics.

(Nota: Esta es una traducción de un recurso educativo abierto creado por el Departamento de Educación del Estado de Nueva York (NYSED) como parte del proyecto "EngageNY" en 2013. Aunque el recurso real fue traducido por personas, la siguiente descripción se tradujo del inglés original usando Google Translate para ayudar a los usuarios potenciales a decidir si se adapta a sus necesidades y puede contener errores gramaticales o lingüísticos. La descripción original en inglés también se proporciona a continuación.)
Los estudiantes crean una comprensión formal de la probabilidad, considerando eventos complejos como sindicatos, intersecciones y complementos, así como el concepto de independencia y probabilidad condicional. La idea de usar una curva suave para modelar una distribución de datos se introduce junto con el uso de tablas y tecnología para encontrar áreas bajo una curva normal. Los estudiantes hacen inferencias y justifican conclusiones de encuestas de muestra, experimentos y estudios de observación. Los datos se usan de muestras aleatorias para estimar una media o proporción de población. Los estudiantes calculan el margen de error y lo interpretan en contexto. Dados los datos de un experimento estadístico, los estudiantes usan la simulación para crear una distribución de aleatorización y lo usan para determinar si hay una diferencia significativa entre dos tratamientos.
Encuentre el resto de los recursos matemáticos de Engageny en https://archive.org/details/engageny-mathematics.
English Description:
Students build a formal understanding of probability, considering complex events such as unions, intersections, and complements as well as the concept of independence and conditional probability. The idea of using a smooth curve to model a data distribution is introduced along with using tables and technology to find areas under a normal curve. Students make inferences and justify conclusions from sample surveys, experiments, and observational studies. Data is used from random samples to estimate a population mean or proportion. Students calculate margin of error and interpret it in context. Given data from a statistical experiment, students use simulation to create a randomization distribution and use it to determine if there is a significant difference between two treatments.
Find the rest of the EngageNY Mathematics resources at https://archive.org/details/engageny-mathematics.
Developed for fifth grade and above. Primary biological content area covered:; Plant growth; Seedling morphology; Hypothesis testing; Experimental design; Line graphing; Introductory statistics.Biology In Elementary Schools is a Saint Michael's College student project. The teaching ideas on this page have been found, refined, and developed by students in a college-level course on the teaching of biology at the elementary level. Unless otherwise noted, the lesson plans have been tried at least once by students from our partner schools. This wiki has been established to share ideas about teaching biology in elementary schools. The motivation behind the creation of this page is twofold: 1. to provide an outlet for the teaching ideas of a group of college educators participating in a workshop-style course; 2. to provide a space where anyone else interested in this topic can place their ideas.
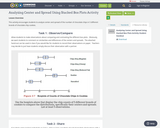
This activity encourages students to analyze center and spread of the number of chocolate chips in 5 different brands of chocolate chip cookies.
A statistics lesson on describing and making claims from data representations, specifically linearly increasing data. Applies ideas of rate-of-change to develop writing a linear equation to fit the data, using the equation to interpolate and extrapolate additional information, and integrating the mathematical interpretation appropriately into a social sciences argument.
This is a free textbook teaching introductory statistics for undergraduates in Psychology. This textbook is part of a larger OER course package for teaching undergraduate statistics in Psychology, including this textbook, a lab manual, and a course website. All of the materials are free and copiable, with source code maintained in Github repositories.
Application of Mathematical Models and Techniques in the field of Statistics.
Pawan Kumar Ray
Assistant Professor
Harkamaya College of Education
6thMile Tadong Gangtok
Email-ccc4job@gmail.com
9832359082/7908401075
Abstract
Mathematics is the science of measurement, quantity and magnitude. Developing children's abilities for mathematics is the main goal of mathematics education. Its knowledge is exact, systematic, logical and clear. Mathematics involves the process for intellectual development of mental faculties. Besides the mental ability, mathematics develops some quality like concentration, truthfulness, seriousness and reasoning. Thus, in the words of Locke it is rightly said that, “Mathematics is a way to settle in the mind the habit of reasoning”. Statistics plays a vital role in every fields of human activity. It has important role in determining the existing position of per capita income, unemployment, population growth rate, housing, schooling medical facilities etc in a country. Modeling and Statistics are two branches of applied mathematics. Modeling involves fitting equations to data, usually just approximately. Statistics is the science of uncertainty. Mathematics is the most closely related subject “Statistics” in our daily life. This paper deals with the concept of the Mathematical techniques, Modeling .The Importance & Uses of Mathematical techniques and Modeling in the field of Statistics. It discusses the different Mathematical techniques and Modeling in respect to statistics. The paper also discusses “How to make statistics easy for learner by using Mathematical techniques and Modeling?”
Key words: Mathematical Modeling, Mathematical Techniques, Statistics, Population.
The textbook is written as a series of Quarto Documents in RStudio and is aimed both as an educational resource on the topic of categorical data analysis and as an aid to the use of the R language for statistical computing. The rendered textbook is interactive with tasks and solution as well as a series of lab questions at the end of each chapter. It also includes OER resources for various introductory math and statistics courses.

This applied mathematics textbook covers Matrices and Pathways, Statistics and Probability, Finance, Cyclic, Recursive and Fractal Patterns, Vectors, and Design. The approach used is primarily data driven, using numerical and geometrical problem-solving techniques.
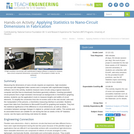
Measuring the dimensions of nano-circuits requires an expensive, high-resolution microscope with integrated video camera and a computer with sophisticated imaging software, but in this activity, students measure nano-circuits using a typical classroom computer and (the free-to-download) GeoGebra geometry software. Inserting (provided) circuit pictures from a high-resolution microscope as backgrounds in GeoGebra's graphing window, students use the application's tools to measure lengths and widths of circuit elements. To simplify the conversion from the on-screen units to the real circuits' units and the manipulation of the pictures, a GeoGebra measuring interface is provided. Students export their data from GeoGebra to Microsoft® Excel® for graphing and analysis. They test the statistical significance of the difference in circuit dimensions, as well as obtain a correlation between average changes in original vs. printed circuits' widths. This activity and its associated lesson are suitable for use during the last six weeks of the AP Statistics course; see the topics and timing note below for details.
This course is an arithmetic course intended for college students, covering whole numbers, fractions, decimals, percents, ratios and proportions, geometry, measurement, statistics, and integers using an integrated geometry and statistics approach. The course uses the late integers modelintegers are only introduced at the end of the course.

“The Art of the Probable” addresses the history of scientific ideas, in particular the emergence and development of mathematical probability. But it is neither meant to be a history of the exact sciences per se nor an annex to, say, the Course 6 curriculum in probability and statistics. Rather, our objective is to focus on the formal, thematic, and rhetorical features that imaginative literature shares with texts in the history of probability. These shared issues include (but are not limited to): the attempt to quantify or otherwise explain the presence of chance, risk, and contingency in everyday life; the deduction of causes for phenomena that are knowable only in their effects; and, above all, the question of what it means to think and act rationally in an uncertain world.
Our course therefore aims to broaden students’ appreciation for and understanding of how literature interacts with – both reflecting upon and contributing to – the scientific understanding of the world. We are just as centrally committed to encouraging students to regard imaginative literature as a unique contribution to knowledge in its own right, and to see literary works of art as objects that demand and richly repay close critical analysis. It is our hope that the course will serve students well if they elect to pursue further work in Literature or other discipline in SHASS, and also enrich or complement their understanding of probability and statistics in other scientific and engineering subjects they elect to take.