Updating search results...

Search Resources

108 Results

View
Selected filters:
  • groundwater
Unit 2: Characterizing groundwater storage with well and GRACE data
Conditional Remix & Share Permitted
CC BY-NC-SA
Rating
0.0 stars

This unit provides students with experience analyzing traditional (depth to water table measured in a well) and geodetic: GRACE (Gravity Recovery and Climate Experiment) data for monitoring changes in groundwater storage in the High Plains Aquifer. Variations across timescales are compared, from seasonal to interannual to decadal. This comparison highlights some of the challenges associated with quantifying changes in groundwater storage at the regional scale. Aquifer properties are used to consider changes in terms of both "depth to water table" and water storage. Students are asked to formulate explanations for the observed variations in the context of the water balance equation. Students compare their results to a multidecadal trend reported in the literature (Konikow, 2011).

Show more about Online Teaching suggestions
Hide
Online-ready: The exercise is electronic and could be done individually or in small online groups. Lecture is best done synchronously due to the technical nature. Discussion would be better that way too.

(Note: this resource was added to OER Commons as part of a batch upload of over 2,200 records. If you notice an issue with the quality of the metadata, please let us know by using the 'report' button and we will flag it for consideration.)

Subject:
Biology
Career and Technical Education
Environmental Studies
Geology
Hydrology
Life Science
Mathematics
Measurement and Data
Physical Science
Statistics and Probability
Material Type:
Activity/Lab
Module
Provider:
Science Education Resource Center (SERC) at Carleton College
Provider Set:
Teach the Earth
Author:
Bruce Douglas
Eric Small
Date Added:
09/26/2022
Unit 2: Monitoring surface and groundwater supply in central and western US
Conditional Remix & Share Permitted
CC BY-NC-SA
Rating
0.0 stars

In Unit 2, students learn how the techniques for water budgeting (covered in Unit 1) can be used to monitor both groundwater (High Plains Aquifer) and surface water (western mountain watershed) systems. Students interpret time-series plots that show the impact of drought years and wet years on underground water storage in the High Plains Aquifer and on snowpack and surface runoff in the western mountain watershed. They also consider the societal implications of water deficits through a series of pre-class readings, questions embedded in the assignments, and small and whole-group discussions. This unit can involve substantial computer time during which students use Excel to view and interpret hydrologic data. An alternative version with hard-copy graphs is also provided.

Show more about Online Teaching suggestions
Hide
Online-adaptable: Both parts of this unit are completely digital and thus at a logistical level it can be switched to online fairly easily. However, due to the relative complexity of the data investigations, there will still be quite a bit of instructor support needed and/or extended small group that should be arranged.

(Note: this resource was added to OER Commons as part of a batch upload of over 2,200 records. If you notice an issue with the quality of the metadata, please let us know by using the 'report' button and we will flag it for consideration.)

Subject:
Hydrology
Physical Science
Material Type:
Activity/Lab
Module
Provider:
Science Education Resource Center (SERC) at Carleton College
Provider Set:
Teach the Earth
Author:
Jonathan Harvey (Fort Lewis College) and Becca Walker (Mt San Antonio College)
Date Added:
09/26/2022
Unit 3: Crops and Irrigation Patterns in the United States
Conditional Remix & Share Permitted
CC BY-NC-SA
Rating
0.0 stars

This unit is designed to allow students to quantitatively assess how much water is used for irrigating crops and how this varies across the United States. This unit also has students link water use to the economic value of the crops that are produced--spanning the scientific and economic disciplines. The concepts that students learn here will connect back to the Water Footprint concept that was introduced in Unit 2, as students consider the accuracy of water calculators.

(Note: this resource was added to OER Commons as part of a batch upload of over 2,200 records. If you notice an issue with the quality of the metadata, please let us know by using the 'report' button and we will flag it for consideration.)

Subject:
Agriculture
Career and Technical Education
Material Type:
Activity/Lab
Module
Provider:
Science Education Resource Center (SERC) at Carleton College
Provider Set:
Teach the Earth
Author:
Chris Sinton
Date Added:
05/04/2021
Unit 3: Monitoring groundwater storage with GPS vertical position
Conditional Remix & Share Permitted
CC BY-NC-SA
Rating
0.0 stars

This unit shows how GPS records of surface elevation can be used to monitor groundwater changes. Students calculate secular trends in the GPS time series and then use the original and detrended records to identify sites that are dominated by the elastic response to regional groundwater changes versus those dominated by local subsidence. They then compare the magnitude and timescales of fluctuations in Earth's surface elevation that result from sediment compaction, regional groundwater extraction, and natural climatic variability. This unit provides students with hands-on experience of the challenges and advantages of using geodetic data to study the terrestrial water cycle. The case study area is in California and the GPS records include the period of the profound 2012 -- 2016 drought.

Show more information on GPS versus GNSS
Hide
Note: Although the term GPS (Global Positioning System) is more commonly used in everyday language, it officially refers only to the USA's constellation of satellites. GNSS (Global Navigation Satellite System) is a universal term that refers to all satellite navigation systems including those from the USA (GPS), Russia (GLONASS), European Union (Galileo), China (BeiDou), and others. In this module, we use the term GPS even though, technically, some of the data may be coming from satellites in other systems.

Show more about Online Teaching suggestions
Hide
Online-ready: The exercise is electronic and could be done individually or in small online groups. Lecture is best done synchronously due to the technical nature. Discussion would be better that way too.

(Note: this resource was added to OER Commons as part of a batch upload of over 2,200 records. If you notice an issue with the quality of the metadata, please let us know by using the 'report' button and we will flag it for consideration.)

Subject:
Biology
Business and Communication
Career and Technical Education
Environmental Studies
Geology
Hydrology
Life Science
Management
Mathematics
Measurement and Data
Physical Science
Political Science
Social Science
Material Type:
Activity/Lab
Case Study
Module
Provider:
Science Education Resource Center (SERC) at Carleton College
Provider Set:
Teach the Earth
Author:
Bruce Douglas
Eric Small
Date Added:
09/26/2022
Unit 4: Groundwater, GPS, and Water Resources
Conditional Remix & Share Permitted
CC BY-NC-SA
Rating
0.0 stars

GPS data can measure ground elevation change in response to the changing amount of groundwater in valleys and snow cover in mountains. In this module, students will learn how to read GPS data to interpret how the amount of groundwater in the Central Valley of California is changing, in particular in reaction to the 2012 -- 2015 drought. They will then apply the skills they develop and knowledge they gain to demonstrate their understanding of how GPS data has implications for the future of groundwater resources in California.

Show more about Online Teaching suggestions
Hide
Online-ready: All exercises are electronic and could be done individually or in small online groups. Lecture as currently provided is best done in synchronous format to retain interactive components.

(Note: this resource was added to OER Commons as part of a batch upload of over 2,200 records. If you notice an issue with the quality of the metadata, please let us know by using the 'report' button and we will flag it for consideration.)

Subject:
Biology
Hydrology
Life Science
Physical Science
Material Type:
Activity/Lab
Module
Provider:
Science Education Resource Center (SERC) at Carleton College
Provider Set:
Teach the Earth
Author:
Karen M. Kortz (Community College of Rhode Island) Jessica J. Smay (San Jose City College)
Date Added:
01/04/2022
Unit 4: Irrigation and Groundwater Mining
Conditional Remix & Share Permitted
CC BY-NC-SA
Rating
0.0 stars

Is groundwater mining sustainable? In Unit 4 students compare and contrast long-term (decades) groundwater well levels in six states representing the East Coast, West Coast, and Midwest Plains states. Satellite imagery maps of the well locations will give students an idea of the land cover, specifically the presence of irrigated crops. Using groundwater well data from the USGS, students will recognize the depletion of aquifers in the western United States (e.g., the Ogallala/High Plains Aquifer), or groundwater mining, as an unsustainable practice.

(Note: this resource was added to OER Commons as part of a batch upload of over 2,200 records. If you notice an issue with the quality of the metadata, please let us know by using the 'report' button and we will flag it for consideration.)

Subject:
Agriculture
Biology
Career and Technical Education
Hydrology
Life Science
Mathematics
Measurement and Data
Physical Science
Statistics and Probability
Material Type:
Activity/Lab
Module
Provider:
Science Education Resource Center (SERC) at Carleton College
Provider Set:
Teach the Earth
Author:
Chris Sinton
Date Added:
03/30/2022
Unit 4: Water budget assessment of a California drought
Conditional Remix & Share Permitted
CC BY-NC-SA
Rating
0.0 stars

The California Drought of 2012 -- 2016 had significant social and economic consequences. This final unit focuses on this drought as a case study for measuring the hydrologic system so that we can better understand fluxes, variability, uncertainties, and methods to measure them. Students analyze a variety of data that are relevant to basin-scale water budget: precipitation, terrestrial water storage, and snow pack. Traditional monitoring systems used are precipitation and snow pillow sensors. The newer geodetic methods are GRACE (Gravity Recovery and Climate Experiment satellite) and Reflection GPS. The students then use these data to consider water storage changes during the drought and how these changes compare in magnitude to human consumption. The work can start during a lab period and carry over into work outside of the lab time. The student exercise takes the form of responses to questions and tasks that tests a student's abilities to synthesize information and identify challenges in monitoring the terrestrial water cycle. Students then take the step-by-step exercise results and synthesize it into a report for California water policy makers to highlight the findings and pro/cons/uncertainties for the different methods. Unit 4 is the summative assessment for the module.

Show more information on GPS versus GNSS
Hide
Note: Although the term GPS (Global Positioning System) is more commonly used in everyday language, it officially refers only to the USA's constellation of satellites. GNSS (Global Navigation Satellite System) is a universal term that refers to all satellite navigation systems including those from the USA (GPS), Russia (GLONASS), European Union (Galileo), China (BeiDou), and others. In this module, we use the term GPS even though, technically, some of the data may be coming from satellites in other systems.

Show more about Online Teaching suggestions
Hide
Online-ready: The exercise is electronic and could be done individually or in small online groups. Lecture is best done synchronously due to the technical nature.

(Note: this resource was added to OER Commons as part of a batch upload of over 2,200 records. If you notice an issue with the quality of the metadata, please let us know by using the 'report' button and we will flag it for consideration.)

Subject:
Biology
Career and Technical Education
Environmental Studies
Geology
Hydrology
Life Science
Mathematics
Measurement and Data
Physical Science
Material Type:
Activity/Lab
Case Study
Module
Provider:
Science Education Resource Center (SERC) at Carleton College
Provider Set:
Teach the Earth
Author:
Bruce Douglas
Eric Small
Date Added:
03/01/2022
Unit 5: Hazardous Waste and Love Canal
Conditional Remix & Share Permitted
CC BY-NC-SA
Rating
0.0 stars

Students explore the classic case of Love Canal, New York, in which Lois Gibbs -- originally described as a "hysterical housewife" -- mobilized her community and called attention to the contamination of groundwater by buried hazardous waste and the resulting impact on the health of local residents. The activities require the students to investigate the history of events at Love Canal. The materials in this unit may be used as a stand-alone day of instruction or as part of the complete Environmental Justice and Freshwater Resources InTeGrate Module.

(Note: this resource was added to OER Commons as part of a batch upload of over 2,200 records. If you notice an issue with the quality of the metadata, please let us know by using the 'report' button and we will flag it for consideration.)

Subject:
Applied Science
Biology
Career and Technical Education
Environmental Studies
Geology
Health, Medicine and Nursing
Hydrology
Life Science
Physical Science
Material Type:
Activity/Lab
Module
Provider:
Science Education Resource Center (SERC) at Carleton College
Provider Set:
Teach the Earth
Author:
Jill Schneiderman
Meg Stewart
Date Added:
09/25/2022
Unit 6: Groundwater Availability and Resources
Conditional Remix & Share Permitted
CC BY-NC-SA
Rating
0.0 stars

Students will utilize the desert Southwest region of the United States and the Ogallala Aquifer in a case study to evaluate issues regarding groundwater and its scarcity. Groundwater is often seen as a limitless resource in the Southwest since there is little regulation controlling the amount that is withdrawn (Rule of Capture). This mentality has led to overuse and to the dwindling supply of groundwater in many parts of the Ogallala Aquifer. This module will help students connect groundwater's role in the hydrological cycle to issues of inequity that can occur when groundwater is not properly regulated.

(Note: this resource was added to OER Commons as part of a batch upload of over 2,200 records. If you notice an issue with the quality of the metadata, please let us know by using the 'report' button and we will flag it for consideration.)

Subject:
Biology
Career and Technical Education
Environmental Studies
Geology
Hydrology
Life Science
Mathematics
Measurement and Data
Physical Science
Material Type:
Activity/Lab
Case Study
Module
Provider:
Science Education Resource Center (SERC) at Carleton College
Provider Set:
Teach the Earth
Author:
Adriana Perez
Joshua Villalobos
Date Added:
09/25/2022
Unit 6: Groundwater Availability and Resources
Conditional Remix & Share Permitted
CC BY-NC-SA
Rating
0.0 stars

In this unit, students address the issue of groundwater demands and environmental justice in the arid Southwest, a region with some of the largest percentages of Hispanics and Latinos in the United States. Students discuss the Rule of Capture, the overuse of water resources, and the dwindling supply of groundwater in many parts of the Ogallala Aquifer. Students connect groundwater's role to the hydrological cycle and consider how issues of inequity can occur when groundwater is not properly regulated.

(Note: this resource was added to OER Commons as part of a batch upload of over 2,200 records. If you notice an issue with the quality of the metadata, please let us know by using the 'report' button and we will flag it for consideration.)

Subject:
Agriculture
Biology
Career and Technical Education
Hydrology
Life Science
Mathematics
Measurement and Data
Physical Science
Statistics and Probability
Material Type:
Activity/Lab
Module
Provider:
Science Education Resource Center (SERC) at Carleton College
Provider Set:
Teach the Earth
Author:
Ruth Hoff
Date Added:
11/23/2021
Using Excel to plot numerical and analytical forms of the diffusion equation
Conditional Remix & Share Permitted
CC BY-NC-SA
Rating
0.0 stars

This computer-based assignment forces students to compare and contrast integral and differential forms of the conservation of mass equation, as well as analytical and numerical approaches to solution. Students are given a text description of a simple environmental problem (a conservative tracer diffusing in a one-dimensional system with no-flux boundaries) and are then required to first write equations that describe the system and then implement these equations in an Excel spreadsheet or Matlab m-file. Students then use their spreadsheets/m-files to compare different solution methods and must communicate these results in short text answers.

(Note: this resource was added to OER Commons as part of a batch upload of over 2,200 records. If you notice an issue with the quality of the metadata, please let us know by using the 'report' button and we will flag it for consideration.)

Subject:
Biology
Hydrology
Life Science
Mathematics
Measurement and Data
Physical Science
Statistics and Probability
Material Type:
Activity/Lab
Provider:
Science Education Resource Center (SERC) at Carleton College
Provider Set:
Teach the Earth
Author:
Anne Lightbody
Date Added:
02/24/2022
Using Wetlands to Teach Hydrogeology
Conditional Remix & Share Permitted
CC BY-NC-SA
Rating
0.0 stars

Wetlands provide an ideal field hydrology laboratory because the water table is so close to the land surface. Eight field exercises, in which students generate their own data, are presented that demonstrate surface-water, vadose-zone, and groundwater hydrology concepts. Standard field equipment and methods are used to conduct investigations including measuring stream discharge, estimating groundwater seepage to a stream and/or pond, preparing a topographic profile showing the water-table configuration, measuring infiltration rates and estimating constant infiltration capacity, measuring field-saturated hydraulic conductivity, estimating hydraulic conductivity from slug tests, and determining the direction, hydraulic gradient, and specific discharge of groundwater. These labs compliment lecture material commonly covered in a first semester hydrology course.

(Note: this resource was added to OER Commons as part of a batch upload of over 2,200 records. If you notice an issue with the quality of the metadata, please let us know by using the 'report' button and we will flag it for consideration.)

Subject:
Biology
Hydrology
Life Science
Physical Science
Material Type:
Activity/Lab
Provider:
Science Education Resource Center (SERC) at Carleton College
Provider Set:
Teach the Earth
Author:
Catherine Carlson
Date Added:
08/27/2020
Using spring water chemistry to understand groundwater inputs
Conditional Remix & Share Permitted
CC BY-NC-SA
Rating
0.0 stars

The assignment will begin with teaching proper water collection and use of equipment for hydrochemical field work. Once the class is familiar with sample collecting technques, the class takes a field trip to several springs within the Madera Limestone, Sandia Mountains New Mexico. Collecting waters and obtaining hydrochemical field parameters for each spring location as well as collecting groundwater from one well in the same aquifer. Returning to the lab and preparing and running samples for ion analysis.

Spring waters will then be compared to well water and average precipitation data available from the USGS. Geochemical modeling will then be completed to understand the proportion of aquifer, precipitation and possible deeply sourced waters found in the spring waters.

The outcomes include 1) teaching proper sampling techniques 2) proper preparation of samples for ion analysis 3) Geochemical modeling to understand mixing

(Note: this resource was added to OER Commons as part of a batch upload of over 2,200 records. If you notice an issue with the quality of the metadata, please let us know by using the 'report' button and we will flag it for consideration.)

Subject:
Career and Technical Education
Chemistry
Environmental Studies
Hydrology
Physical Science
Material Type:
Activity/Lab
Homework/Assignment
Provider:
Science Education Resource Center (SERC) at Carleton College
Provider Set:
Teach the Earth
Author:
Rebecca Frus
Date Added:
08/06/2019
Using the EXCEL Woburn Flow and Transport Model to Teach Modeling Concepts
Conditional Remix & Share Permitted
CC BY-NC-SA
Rating
0.0 stars

To prepare for this project / assignment, students could view the 'A Civil Action' movie, the instructor could read to them excerpts from the book and/or the trial testimony, and show them images from Woburn, wells G and H, the subsurface geologic materials, geologic cross sections, the trial participants, and the federal courtroom in Boston (see below). The materials in Bair (2001) about scientists in the courtroom, specific (excerpted) testimony presented by the three expert witnesses in the 'A Civil Action' trial, a chart summarizing the differences in their testimony, and the views of a federal judge on the goal of science versus the goal of a civil trial may also be worthwhile reading by the class prior to the assignment.

The instructor could show students the large plates included in the USGS report by Myette and others (1987) that display potentiometric data and contours before and after the critically important aquifer test performed in December 1985 and January 1986, just before the trial, and discuss the significance of the stream discharge measurement made by the USGS upstream and downstream of municipal wells G and H to the experts' testimony and the outcome of the trial.

The instructor could also show the animations of TCE movement from 1960 to 1986 from the five known sources of TCE contamination at the Woburn Wells G & H Superfund Site (W.R. Grace, UniFirst dry cleaners, Olympia Trucking, Beatrice Foods, and New England Plastics) and the animation showing temporal changes in induced infiltration from the Aberjona River to wells G and H that were created by Martin van Oort (M.S., 2005) based on the research of Maura Metheny (M.S., 1998; Ph.D., 2004) at Ohio State University.

The article by Bair and Metheny (2002) concerning the remediation activities subsequent to the famous trial at the Wells G & H Superfund Site could be used to show how groundwater contamination is cleaned up, why different remediation schemes needed to be used in different hydrogeologic settings, and why cleanup to U.S. EPA standards can take decades.

(Note: this resource was added to OER Commons as part of a batch upload of over 2,200 records. If you notice an issue with the quality of the metadata, please let us know by using the 'report' button and we will flag it for consideration.)

Subject:
Biology
Business and Communication
Hydrology
Life Science
Management
Mathematics
Measurement and Data
Physical Science
Political Science
Social Science
Statistics and Probability
Material Type:
Activity/Lab
Provider:
Science Education Resource Center (SERC) at Carleton College
Provider Set:
Teach the Earth
Author:
Scott Bair
Date Added:
08/10/2019
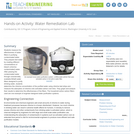
Water Remediation Lab
Read the Fine Print
Educational Use
Rating
0.0 stars

Students measure the effectiveness of water filters in purifying contaminated water. They prepare test water by creating different concentrations of bleach (chlorine-contaminated) water. After passing the contaminated water through commercially available Brita® water filters designed to purify drinking water, students determine the chlorine concentration of the purified water using chlorine test strips and measure the adsorption of chlorine onto activated carbon over time. They graph and analyze their results to determine the effectiveness of the filters. The household active carbon filters used are one example of engineer-designed water purification systems.

Subject:
Applied Science
Chemistry
Engineering
Physical Science
Material Type:
Activity/Lab
Provider:
TeachEngineering
Provider Set:
TeachEngineering
Author:
Barry Williams
Jessica Ray
Phyllis Balcerzak
Date Added:
09/18/2014
Water Runoff:  How the Ground Water in Your Community is Affected
Conditional Remix & Share Permitted
CC BY-NC-SA
Rating
0.0 stars

This activity is a 3 part lab activity where students create a model of an area in a community. The students test how dirty water flows through their models observing where water is filtered or not. Using what was learned by the models, students will draw a community scene that has man made areas alongside areas that benefit groundwater filtration.

Subject:
Hydrology
Physical Science
Material Type:
Activity/Lab
Provider:
Science Education Resource Center (SERC) at Carleton College
Provider Set:
Pedagogy in Action
Author:
Nancy Thill
Date Added:
08/16/2012
Water and Mud: Linking hydrogeology and landscape change
Conditional Remix & Share Permitted
CC BY-NC-SA
Rating
0.0 stars

This exercise demonstrates the role of groundwater in Earth's surface processes and natural hazards through a simple sensitivity analysis using Excel and a case study of a landslide in glacial sediments. In the first part of the exercise, students use a spreadsheet to model the infinite slope equation to determine which variables are sensitive to change. In this part of the exercise students discover the relationship and importance between hydrogeology and Earth's surface processes. In the second part of the exercise students use a case study, of a landslide that occurred in glacial sediments, to calculate the lag time between precipitation events and slope failure. This exercise highlights the relationship between groundwater and natural hazards. Finally, students combine their knowledge of both exercises and use the infinite slope equation to predict the percent of ground saturation for the landslide case study.

(Note: this resource was added to OER Commons as part of a batch upload of over 2,200 records. If you notice an issue with the quality of the metadata, please let us know by using the 'report' button and we will flag it for consideration.)

Subject:
Biology
Hydrology
Life Science
Physical Science
Material Type:
Activity/Lab
Case Study
Provider:
Science Education Resource Center (SERC) at Carleton College
Provider Set:
Teach the Earth
Author:
Kyle Nichols
Date Added:
09/04/2019
Watershed Balance
Read the Fine Print
Educational Use
Rating
0.0 stars

Students learn about the water cycle and its key components. First, they learn about the concept of a watershed and why it is important in the context of engineering hydrology. Then they learn how we can use the theory of conservation of mass to estimate the amount of water that enters a watershed (precipitation, groundwater flowing in) and exits a watershed (evaporation, runoff, groundwater out). Finally, students learn about runoff and how we visualize runoff in the form of hydrographs.

Subject:
Applied Science
Engineering
Hydrology
Physical Science
Material Type:
Lesson Plan
Provider:
TeachEngineering
Provider Set:
TeachEngineering
Author:
Emily Gill
Malinda Schaefer Zarske
Date Added:
09/18/2014
Watershed area and discharge relationships
Conditional Remix & Share Permitted
CC BY-NC-SA
Rating
0.0 stars

Students use USGS WaterData website to find data on area, average annual discharge and response to high-precip events in small watersheds in southern New England. Data for the class are compiled to generate graphs showing the regional relationships between (1) area and discharge, and (2) area and time-lag between precip and maximum discharge.

terms: discharge, watershed, flood

(Note: this resource was added to OER Commons as part of a batch upload of over 2,200 records. If you notice an issue with the quality of the metadata, please let us know by using the 'report' button and we will flag it for consideration.)

Subject:
Hydrology
Physical Science
Material Type:
Activity/Lab
Provider:
Science Education Resource Center (SERC) at Carleton College
Provider Set:
Teach the Earth
Author:
Steven Petsch
Date Added:
09/06/2020