Updating search results...

Search Resources

1221 Results

View
Selected filters:
  • Statistics and Probability
Mostly Harmless  Probability and Statistics for NMC
Conditional Remix & Share Permitted
CC BY-SA
Rating
0.0 stars

This text is for an introductory level course in probability and statistics.

This work, "Mostly Harmless Probability and Statistics for NMC", is a derivative of "Mostly
Harmless Statistics" by Rachel Webb used under CC BY-NC 4.0. "Mostly Harmless Probability
and Statistics for NMC" is licensed under CC BY-NC 4.0 by Briana Mills.

Rachel Webb’s original text was a combination of Webb’s work, Statistics
Using Technology by Kathryn Kozak, and OpenIntro Statistics by Diez, Barr, Çetinkaya-Rundel.
All texts are licensed under CC BY-SA 4.0. Additional problem sets provided by Whitney Cave.
It has been updated by Briana Mills with help from Nate Butler and Tony Jenkins to match the
curriculum at NMC.

The textbook solutions for this book are available at: https://drive.google.com/drive/u/1/folders/1BTXchIplWzk0mjohao2xrE4cfeOOUsvI

Subject:
Mathematics
Statistics and Probability
Material Type:
Textbook
Author:
Briana Mills
Date Added:
05/31/2022
Mostly Harmless Statistics
Conditional Remix & Share Permitted
CC BY-SA
Rating
0.0 stars

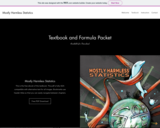
This text is for an introductory level probability and statistics course with an intermediate algebra prerequisite. The focus of the text follows the American Statistical Association’s Guidelines for Assessment and Instruction in Statistics Education (GAISE). Software examples provided for Microsoft Excel, TI-84 & TI-89 calculators. A formula packet and pdf version of the text are available on the website http://mostlyharmlessstatistics.com. Students new to probability and statistics are sure to benefit from this fully ADA accessible and relevant textbook. The examples resonate with everyday life, the text is approachable, and has a conversational tone to provide an inclusive and easy to read format for students.

Subject:
Mathematics
Statistics and Probability
Material Type:
Textbook
Author:
Rachel L. Webb
Date Added:
11/18/2021
Mouse Experiment
Conditional Remix & Share Permitted
CC BY-NC-SA
Rating
0.0 stars

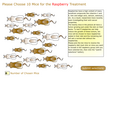
This Flash based applet simulates data from a case study of treatments for tumor growth in mice. This simulation allows the user to place mice into a control and treatment groups.

Subject:
Mathematics
Statistics and Probability
Material Type:
Activity/Lab
Provider:
Consortium for the Advancement of Undergraduate Statistics Education
Provider Set:
Causeweb.org
Author:
Dennis Pearl
Tom Santner
Date Added:
02/16/2011
Multiple linear regression (10:43)
Only Sharing Permitted
CC BY-NC-ND
Rating
0.0 stars

An introduction and examples of how to use Multiple linear regression. The Linear regression model investigates a linear relationship. The dependent variable should be quantitative and normally distributed. The Multiple Regression Model includes more than one independent variable. The Multiple Regression Model is introduced with real data from the Swedish pregnancy register.

Subject:
Applied Science
Health, Medicine and Nursing
Mathematics
Statistics and Probability
Material Type:
Lecture
Provider:
Umeå University
Provider Set:
Quantitative Research Methods
Author:
Marie Lindqvist
Associate professor in epidemiology and biostatistics
Date Added:
11/01/2014
Music and Sports
Unrestricted Use
CC BY
Rating
0.0 stars

In this group task students collect data and analyze from the class to answer the question "is there an association between whether a student plays a sport and whether he or she plays a musical instrument? "

Subject:
Mathematics
Statistics and Probability
Material Type:
Activity/Lab
Provider:
Illustrative Mathematics
Provider Set:
Illustrative Mathematics
Author:
Illustrative Mathematics
Date Added:
10/09/2012
My Dream Home
Unrestricted Use
Public Domain
Rating
0.0 stars

Students will analyze and interpret American Community Survey (ACS) data on housing characteristics in the United States, comparing these data with those they collect from their classmates. Students also will determine what their dream home would look like and will use flat, two-dimensional shapes to construct it.

Subject:
Mathematics
Statistics and Probability
Material Type:
Activity/Lab
Provider:
U.S. Census Bureau
Provider Set:
Statistics in Schools
Date Added:
10/15/2019
My Special Place
Conditional Remix & Share Permitted
CC BY-NC-SA
Rating
0.0 stars

Students pick a place of significance to them (their Special Place) for analysis in this semester-long project. (A model is provided by the instructor using a place the students are not likely to have visited.)

(Note: this resource was added to OER Commons as part of a batch upload of over 2,200 records. If you notice an issue with the quality of the metadata, please let us know by using the 'report' button and we will flag it for consideration.)

Subject:
Biology
Geoscience
Life Science
Mathematics
Measurement and Data
Physical Science
Statistics and Probability
Material Type:
Lesson Plan
Provider:
Science Education Resource Center (SERC) at Carleton College
Provider Set:
Teach the Earth
Author:
Sadredin Moosavi
Date Added:
09/11/2020
Mystery in Alaska: A Study of the 2000 Fishing Ban
Conditional Remix & Share Permitted
CC BY-NC-SA
Rating
0.0 stars

Solving Mystery in Alaska and investigating the role of science in July 2000 Alaska fishing ban with the intention to protect Steller sea lions.

Subject:
Business and Communication
Communication
Composition and Rhetoric
English Language Arts
Mathematics
Measurement and Data
Statistics and Probability
Material Type:
Activity/Lab
Provider:
Science Education Resource Center (SERC) at Carleton College
Provider Set:
Teach the Earth
Author:
Tun Myint
Date Added:
01/20/2023
Narratives and Names
Unrestricted Use
Public Domain
Rating
0.0 stars

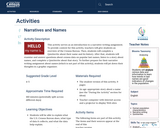
This activity serves as an introduction to a narrative writing assignment. To provide context for this activity, teachers will give students an overview of the Census Bureau. Then, students will complete a Quickwrite about their name and its history. After that, students will examine and answer questions about census data on popular last names, listen to a story about names, and complete a Quickwrite about that story. To further prepare for their narrative writing assignment about names (which is not part of this activity), students will jot down their thoughts in a graphic organizer.

Subject:
Mathematics
Statistics and Probability
Material Type:
Activity/Lab
Provider:
U.S. Census Bureau
Provider Set:
Statistics in Schools
Date Added:
10/18/2019
Narratives and the Policy Process: Applications of the Narrative Policy Framework
Only Sharing Permitted
CC BY-NC-ND
Rating
0.0 stars

Applications of the Narrative Policy Framework

Word Count: 101834

(Note: This resource's metadata has been created automatically by reformatting and/or combining the information that the author initially provided as part of a bulk import process.)

Subject:
Applied Science
Information Science
Mathematics
Statistics and Probability
Material Type:
Textbook
Provider:
Montana State University
Date Added:
01/26/2024
National Health and Nutrition Examination Survey (NHANES) Data Portal
Unrestricted Use
CC BY
Rating
0.0 stars

Access and explore large datasets from the National Health and Nutrition Examination Survey (NHANES, 2003). Working with large datasets that emphasize exploration, finding patterns, and modeling is an essential first step in becoming fluent with data. This activity is a great place for students to start, since the dataset is straightforward and students can decide on the data they want to explore, including height, age, weight, and many other health-related attributes. Students begin by selecting and then investigating subsets of the dataset, for example, to find the cholesterol level of U.S. citizens. Then, working with their classmates or individually, students can try their own data science challenges, such as finding health trends in a subset of Americans by their household income, age, or marital status, etc.

Subject:
Mathematics
Measurement and Data
Statistics and Probability
Material Type:
Activity/Lab
Simulation
Author:
Concord Consortium
Date Added:
08/20/2020
Native American Dwellings
Unrestricted Use
Public Domain
Rating
0.0 stars

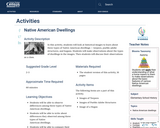
In this activity, students will look at historical images to learn about three types of Native American dwellings — teepees, pueblo adobe structures, and hogans. Students will make observations about the types of dwellings in the images. Then students will discuss their observations as a class.

Subject:
Mathematics
Statistics and Probability
Material Type:
Activity/Lab
Provider:
U.S. Census Bureau
Provider Set:
Statistics in Schools
Date Added:
10/16/2019
Natural Resources Biometrics
Conditional Remix & Share Permitted
CC BY-NC-SA
Rating
0.0 stars

Short Description:
Return to milneopentextbooks.org to download PDF and other versions of this textNewParaNatural Resources Biometrics begins with a review of descriptive statistics, estimation, and hypothesis testing. The following chapters cover one- and two-way analysis of variance (ANOVA), including multiple comparison methods and interaction assessment, with a strong emphasis on application and interpretation. Simple and multiple linear regressions in a natural resource setting are covered in the next chapters, focusing on correlation, model fitting, residual analysis, and confidence and prediction intervals. The final chapters cover growth and yield models, volume and biomass equations, site index curves, competition indices, importance values, and measures of species diversity, association, and community similarity.

Long Description:
Natural Resources Biometrics begins with a review of descriptive statistics, estimation, and hypothesis testing. The following chapters cover one- and two-way analysis of variance (ANOVA), including multiple comparison methods and interaction assessment, with a strong emphasis on application and interpretation. Simple and multiple linear regressions in a natural resource setting are covered in the next chapters, focusing on correlation, model fitting, residual analysis, and confidence and prediction intervals. The final chapters cover growth and yield models, volume and biomass equations, site index curves, competition indices, importance values, and measures of species diversity, association, and community similarity.

Word Count: 52267

ISBN: 978-1-942341-17-8

(Note: This resource's metadata has been created automatically by reformatting and/or combining the information that the author initially provided as part of a bulk import process.)

Subject:
Ecology
Life Science
Mathematics
Statistics and Probability
Material Type:
Textbook
Provider:
State University of New York
Author:
Diane Kiernan
Date Added:
01/16/2014
Neural Networks
Only Sharing Permitted
CC BY-NC-ND
Rating
0.0 stars

This lesson centers around the How AI Works: Neural Networks video from the How AI Works video series. Watch this video first before exploring the lesson plan.

Students learn how neural networks work. They first discuss an example of an experience that recommends things to you. They then use a widget that recommends videos based on one person. Students watch a video explaining neural networks. They use an updated widget to adjust the weights of each person. Finally, students discuss the need for diverse perspectives when creating recommendation systems.

This lesson can be taught on its own, or as part of a 7-lesson sequence on How AI Works. Duration: 45 minutes

Subject:
Applied Science
Computer Science
Mathematics
Statistics and Probability
Material Type:
Lesson Plan
Provider:
Code.org
Provider Set:
How AI Works
Date Added:
04/03/2024
Neural Networks: Crash Course Statistics #41
Read the Fine Print
Some Rights Reserved
Rating
0.0 stars

Today we're going to talk big picture about what Neural Networks are and how they work. Neural Networks, which are computer models that act like neurons in the human brain, are really popular right now - they're being used in everything from self-driving cars and Snapchat filters to even creating original art! As data gets bigger and bigger neural networks will likely play an increasingly important role in helping us make sense of all that data.

Subject:
Mathematics
Statistics and Probability
Material Type:
Lecture
Provider:
Complexly
Provider Set:
Crash Course Statistics
Date Added:
12/12/2018
The New Normal
Unrestricted Use
Public Domain
Rating
0.0 stars

Students will explore distributions of various census data sets to determine whether it can be reasonably assumed that those data follow a normal distribution, based on students’ analysis of either a histogram or a normal probability plot for each data set. They will then discuss their findings with a partner who analyzed the other type of graph for each data set.

Subject:
Mathematics
Statistics and Probability
Material Type:
Activity/Lab
Provider:
U.S. Census Bureau
Provider Set:
Statistics in Schools
Date Added:
10/15/2019
Normal Distribution
Conditional Remix & Share Permitted
CC BY-NC-SA
Rating
0.0 stars

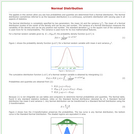
The applets in this section allow users to see how probabilities and quantiles are determined from a Normal distribution. For calculating probabilities, set the mean, variance, and limits; for calculating quantiles, set the mean, variance, and probability.

Subject:
Mathematics
Statistics and Probability
Material Type:
Activity/Lab
Provider:
Consortium for the Advancement of Undergraduate Statistics Education
Provider Set:
Causeweb.org
Author:
C. Anderson-Cook, S. Dorai-Raj, T. Robinson, Virginia Tech Department of Statistics
Date Added:
02/16/2011
The Normal Distribution: Crash Course Statistics #19
Read the Fine Print
Some Rights Reserved
Rating
0.0 stars

Today is the day we finally talk about the normal distribution! The normal distribution is incredibly important in statistics because distributions of means are normally distributed even if populations aren't. We'll get into why this is so - due to the Central Limit Theorem - but it's useful because it allows us to make comparisons between different groups even if we don't know the underlying distribution of the population being studied.

Subject:
Mathematics
Statistics and Probability
Material Type:
Lecture
Provider:
Complexly
Provider Set:
Crash Course Statistics
Date Added:
06/06/2018
Normal Distribution Lesson
Conditional Remix & Share Permitted
CC BY-NC
Rating
0.0 stars

Lesson introduces normal distribution and how it relates to standard deviation. It includes opportunities for students to notice key features of normal distribution graphs, reviews the concept of standard distribution and the empirical rule, and provides an interactive activity where they can practice adjusting normal distribution curves based on a different standard deviation or mean.

Subject:
Mathematics
Statistics and Probability
Material Type:
Activity/Lab
Author:
Melissa Hesterman
Date Added:
10/01/2019