Updating search results...

Search Resources

4256 Results

View
Selected filters:
  • geoscience
Coral Reefs
Read the Fine Print
Rating
0.0 stars

In this video, Jonathan examines the biology of coral reefs and their importance to the marine ecosystem. Please see the accompanying lesson plan that discusses pH and ocean acidification for educational objectives, discussion points and classroom activities.

Subject:
Oceanography
Physical Science
Material Type:
Diagram/Illustration
Lesson Plan
Provider:
Jonathan Bird's Blue World
Provider Set:
Jonathan Bird's Blue World
Author:
Jonathan Bird Productions
Oceanic Research Group
Date Added:
03/01/2012
Coral Reefs in Hot Water
Read the Fine Print
Rating
0.0 stars

In this activity, student teams identify the locations of coral reefs around the world, examine infrared satellite images of the Earth, and research the impacts that are threatening the survival of coral reefs. Each team creates a short oral presentation describing the coral reef they have researched. Students then plot on a composite map the locations where coral bleaching is occurring. Student worksheets, a teacher guide, and assessment rubric are included. This activity is part of Coastal Areas: Coral Reefs in Hot Water, part of the lesson series, The Potential Consequences of Climate Variability and Change.

Subject:
Atmospheric Science
Geoscience
Life Science
Oceanography
Physical Science
Material Type:
Lecture Notes
Provider:
NASA
Provider Set:
NASA Wavelength
Date Added:
11/05/2014
Coral Reefs in Hot Water
Unrestricted Use
CC BY
Rating
0.0 stars

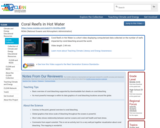
Coral Reefs in Hot Water is a short video displaying computerized data collected on the number of reefs impacted by coral bleaching around the world.

Subject:
Applied Science
Biology
Career and Technical Education
Environmental Science
Environmental Studies
Life Science
Oceanography
Physical Science
Provider:
CLEAN: Climate Literacy and Energy Awareness Network
Provider Set:
CLEAN: Climate Literacy and Energy Awareness Network
Author:
NOAA (National Oceanic and Atmospheric Administration)
Date Added:
06/19/2012
Core Description, Stratigraphic Correlation, and Mapping: A capstone project for an undergraduate course in Sedimentary Geology
Conditional Remix & Share Permitted
CC BY-NC-SA
Rating
0.0 stars

This project is intended as a long-term (3 weeks -- 1 month) lab exercise near the end of a combined Stratigraphy/Sedimentology course. The project utilizes real world data provided by CONSOL Energy of Pittsburgh, PA, and the West Virginia Geological and Economic Survey. This project has been assigned once and is being revised. Instructions have been left somewhat vague in an attempt to force students into discovering some of the more mechanical details of this process themselves.

By the latter third of the course, students have described sedimentary rocks in detail and have constructed vertical sections of rock at several outcrops around campus. The course is moving from Sedimentology/Petrology into Stratigraphy. This project is designed to illustrate the basic principles of lithostratigraphy, which are covered concurrently in the lecture portion of the class.

The project 'unfurls' over several weeks. If students are provided with the entire project at one time they generally get overwhelmed, so the project is presented piecemeal, allowing the students to expand the project as they complete one section.

Step 1: Core description 40 feet of core from the Conemaugh Group of southwestern Pennsylvania is made available to the students. They must describe the core, define lithologic units, identify specific sedimentary structures, and construct a stratigraphic column. (Students struggle with detail versus efficiency of completion, given one full lab period (3 hours) and a week to complete the assignment, many students will get lost in the detail)

The goal is to build familiarity with the type of data available to geologists as they go about constructing maps for resource estimates. Additionally, the lithologies present in this core will be similar to those described in the geologist and drilling logs necessary to complete the next step.

Each step is evaluated independently in this step concern is primarily with identification of basic lithologies (coal, sandstone, shale, limestone).

Step 2: construction of strip logs for 25 core holes in northern West Virginia. Students are provided with a location map, logs for 25 holes, and elevation data. They must construct strip logs suitable for correlation, deciding upon scale and detail of presentation. Students are provided with a CD including the location map and a .pdf for each drill record.

The logs vary between the simplicity of driller data (60' of "blue" shale) and the detail of geologist descriptions, students must balance the detail and simplicity. Additionally, students were faced with "long" logs (i.e. greater than 500') and "short" logs (i.e. less than 100'). This turned out to be extremely difficult, some students got very lost, producing long detailed logs that left them without much time for the last two steps.

Students are again provided with a week to construct the strip logs, including the lab time for the week. Strip logs are evaluated for detail, accuracy, and utility (in many cases too much detail can be as confusing as too little).

Step 3: construction of stratigraphic cross sections. The first time this project was assigned, there was little guidance provided to students beyond "choosing logs that covered the largest stratigraphic interval." This exceeded the grasp of most students so additional guidance will be provided in the next iteration of this project. A generalized stratigraphic column illustrating the basic characteristics of the Monongahela and Conemaugh groups will be provided to assist students with recognition of the basic formations.

Students will be required to construct a stratigraphic cross section through selected wells on the west side of the project area. This cross section will demonstrate the use of marker beds and the lateral continuity of stratigraphic units.

The second cross section will run east-west onto the western flank of the Chestnut Ridge anticline. The datum for this cross section will be surface elevation. This cross section will illustrate the problems of stratigraphic correlation when combined with geological structures. The rock becomes consistently older as one proceeds towards the axis of the anticline. The prominent red beds and the absence of coals, in the eastern portion of the map area indicate the presence of the Chestnut Ridge Anticline.

Evaluation of the cross sections will be based upon the accuracy of the correlations. Students are allowed a week to produce cross sections (including lab). The stratigraphic cross section should accurately delineate the Redstone, Pittsburgh, and Sewickley coals. These occur in sequence and are fairly easy to identify. Successful completion of the east-west cross section will require identification of the approximate stratigraphic position of the Monongahela-Conemaugh contact.

Step 4: construction of isopach maps. Students are then required to identify specific coal and sandstone units within their cross sections, correlate those across the map region and construct isopach maps of those units.

This requires that the students now extend what they have learned from the previous three weeks, extend those correlations to the core holes not included in the basic stratigraphic analysis. The thickness of the coal and sandstone should be identified and isopach maps constructed.

The first iteration of this project produced problems similar to those encountered in step 3. Better guidance and evaluation of the cross sections and allowing students less input on the choice of stratigraphic units to isopach should reduce the confusion.

Step 5: (optional) Interpretation and report writing : the first iteration of this project was running concurrently with a term paper. Instead of two separate projects, an interpretive report will be required. This is still in the planning stage and has not been assigned to students.

(Note: this resource was added to OER Commons as part of a batch upload of over 2,200 records. If you notice an issue with the quality of the metadata, please let us know by using the 'report' button and we will flag it for consideration.)

Subject:
Biology
Life Science
Material Type:
Lesson Plan
Provider:
Science Education Resource Center (SERC) at Carleton College
Provider Set:
Teach the Earth
Author:
David Matchen
Date Added:
08/28/2019
Coriolis Effect Activity
Conditional Remix & Share Permitted
CC BY-NC-SA
Rating
0.0 stars

The Coriolis Effect is the deflection of moving objects when they are viewed in a rotating reference frame. In oceanography, we are most interested in how the Coriolis Effect moves winds and ocean currents on the rotating Earth. This activity is a simple demonstration for students to understand the Coriolis Effect by drawing arrows as they rotate a double-sided copy of the northern and southern hemispheres. My goal was to create something simple for students to use themselves to understand the Coriolis Effect.

Subject:
Oceanography
Physical Science
Material Type:
Activity/Lab
Provider:
Science Education Resource Center (SERC) at Carleton College
Provider Set:
Teach the Earth
Author:
Laura Wetzel
Date Added:
01/20/2023
Correlation
Conditional Remix & Share Permitted
CC BY-NC-SA
Rating
0.0 stars

Three hypothetical rock sections along an East-West transect are provided. Students correlate the three sections using the biostratigraphy of planktic forams (as a proxy for age), benthic forams (as a proxy of depth), and lithology (as a proxy of environment). Students are asked to provide an interpretation of the history of this depositional basin. An ash bed of known age is added and students are asked to determine if this new information affects their interpretation. Finally, an interesting lithologic feature is added, and students are asked to provide a geological explanation.

(Note: this resource was added to OER Commons as part of a batch upload of over 2,200 records. If you notice an issue with the quality of the metadata, please let us know by using the 'report' button and we will flag it for consideration.)
Subject:
Biology
Career and Technical Education
Environmental Studies
Life Science
Material Type:
Activity/Lab
Provider:
Science Education Resource Center (SERC) at Carleton College
Provider Set:
Teach the Earth
Author:
Pennilyn Higgins
Date Added:
08/28/2019
Corrupted Politicians
Read the Fine Print
Some Rights Reserved
Rating
0.0 stars

You can find statistics in every day life - this example explains how to calculate the chance of a member of a committee is receiving a bribe. This resource is from PUMAS - Practical Uses of Math and Science - a collection of brief examples created by scientists and engineers showing how math and science topics taught in K-12 classes have real world applications.

Subject:
Geoscience
Mathematics
Physical Science
Material Type:
Lecture
Provider:
NASA
Provider Set:
NASA Wavelength
Date Added:
11/05/2014
The Cosmic Calendar
Conditional Remix & Share Permitted
CC BY-NC-SA
Rating
0.0 stars

This activity from the Astronomical Society of the Pacific asks students to compress all of time (from the Big Bang until now) into one year.
First, they have to pick major events (younger students can be given them) - this can lead to lively discussion! You can certainly be adaptable here.
Second, the best thing to do is have the students guess where each event should be on the Cosmic Calendar.
Third, have them look up or be given the actual time period when the event occurred.
Fourth, have them calculate (or be given) the "date" on the Cosmic Calendar.
Fifth, discuss! Debate! Reflect!

Files cannot be uploaded as they are copyrighted but they are easily found and freely available.
Authors: Therese Puyau Blanchard, Andrew Fraknoi, and the staff of the Astronomical Society of the Pacific
URL: http://www.astrosociety.org/edu/astro/act2/H2_Cosmic_Calendar.pdf

(Note: this resource was added to OER Commons as part of a batch upload of over 2,200 records. If you notice an issue with the quality of the metadata, please let us know by using the 'report' button and we will flag it for consideration.)

Subject:
Biology
Geology
Life Science
Physical Science
Material Type:
Activity/Lab
Homework/Assignment
Provider:
Science Education Resource Center (SERC) at Carleton College
Provider Set:
Teach the Earth
Author:
Erika Grundstrom
Date Added:
08/23/2019
Cosmic Origin Spectrograph
Read the Fine Print
Educational Use
Rating
0.0 stars

This video from NASA features the Cosmic Origin Spectrograph (COS), which allows scientists to use spectrographic analysis to assess the composition of intergalactic material.

Subject:
Applied Science
Chemistry
Engineering
Geoscience
Physical Science
Physics
Space Science
Technology
Material Type:
Lesson
Provider:
PBS LearningMedia
Provider Set:
PBS Learning Media Common Core Collection
Author:
NASA
WGBH Educational Foundation
WNET
Date Added:
05/23/2012
Cost Effectiveness of Increased Fuel Efficiency
Conditional Remix & Share Permitted
CC BY-NC-SA
Rating
0.0 stars

In this example students examine and critique an argument which implies that it is not cost effective to pay for an automobile with increased fuel efficiency. Using a few reasonable assumptions shows that some of the writer's quantitative claims are not very accurate.

(Note: this resource was added to OER Commons as part of a batch upload of over 2,200 records. If you notice an issue with the quality of the metadata, please let us know by using the 'report' button and we will flag it for consideration.)
Subject:
Physical Science
Physics
Material Type:
Activity/Lab
Provider:
Science Education Resource Center (SERC) at Carleton College
Provider Set:
Teach the Earth
Author:
Stuart Boersma
Date Added:
09/23/2022
The Costs of Your Commute: Your Money, Your Time, and the Earth
Conditional Remix & Share Permitted
CC BY-NC-SA
Rating
0.0 stars

This activity has students investigate their own cost, CO2 output, and time for commuting. They then compare their commute to an environmentally conscious alternative by using comparable metrics.

(Note: this resource was added to OER Commons as part of a batch upload of over 2,200 records. If you notice an issue with the quality of the metadata, please let us know by using the 'report' button and we will flag it for consideration.)

Subject:
Applied Science
Biology
Environmental Science
Life Science
Mathematics
Measurement and Data
Statistics and Probability
Material Type:
Activity/Lab
Provider:
Science Education Resource Center (SERC) at Carleton College
Provider Set:
Teach the Earth
Author:
Charlie Buehrle
Date Added:
04/17/2018
Counting Graylings on the Tundra
Conditional Remix & Share Permitted
CC BY-SA
Rating
0.0 stars

This article profiles Linda Deegan, scientist with the Arctic Long-Term Ecological Research site in the Kuparuk River region of Alaska, as she counts and tags Arctic grayling as they migrate from streams to lakes in the fall.

Subject:
Applied Science
Environmental Science
Geoscience
Physical Science
Material Type:
Reading
Provider:
Ohio State University College of Education and Human Ecology
Provider Set:
Beyond Penguins and Polar Bears: An Online Magazine for K-5 Teachers
Author:
Carol Landis
Date Added:
10/17/2014
Counting Grizzly Bears: An Exercise in Historical Reasoning
Conditional Remix & Share Permitted
CC BY-NC-SA
Rating
0.0 stars

This assignment engages students in an environmental history class in the use of quantitative data, and raises questions about the nature and meaning of that data, and how it might be utilized.

(Note: this resource was added to OER Commons as part of a batch upload of over 2,200 records. If you notice an issue with the quality of the metadata, please let us know by using the 'report' button and we will flag it for consideration.)
Subject:
Applied Science
Environmental Science
Material Type:
Activity/Lab
Provider:
Science Education Resource Center (SERC) at Carleton College
Provider Set:
Teach the Earth
Author:
George Vrtis
Date Added:
12/22/2019
Coupled Substitutions
Conditional Remix & Share Permitted
CC BY-NC-SA
Rating
0.0 stars

Students are given two questions for each concept, in which they must (1) calculate the composition of minerals in weight percent given relative proportions of given end members and (2) calculate mole percentages for feldspars based on their mineral analyses (provided).

(Note: this resource was added to OER Commons as part of a batch upload of over 2,200 records. If you notice an issue with the quality of the metadata, please let us know by using the 'report' button and we will flag it for consideration.)

Subject:
Biology
Geology
Life Science
Physical Science
Material Type:
Activity/Lab
Provider:
Science Education Resource Center (SERC) at Carleton College
Provider Set:
Teach the Earth
Author:
Joseph Smyth
Date Added:
09/27/2022
Courting Environmental Justice: Science, Community Knowledge and Public Health
Conditional Remix & Share Permitted
CC BY-NC-SA
Rating
0.0 stars

While this module was developed when we followed the federal criminal case around WR Grace and asbestos exposure in a small Montana mining town, it can be adapted for a range of learning experiences regarding environmental justice, argumentation, strategizing, remediation and sustainability.

(Note: this resource was added to OER Commons as part of a batch upload of over 2,200 records. If you notice an issue with the quality of the metadata, please let us know by using the 'report' button and we will flag it for consideration.)
Subject:
Applied Science
Biology
Career and Technical Education
Environmental Studies
Health, Medicine and Nursing
Life Science
Social Science
Sociology
Material Type:
Activity/Lab
Provider:
Science Education Resource Center (SERC) at Carleton College
Provider Set:
Teach the Earth
Author:
Lin Nelson, The Evergreen State College
Date Added:
12/09/2021
Cracking and Crumbling: Exploring Mechanisms of Dike Emplacement
Conditional Remix & Share Permitted
CC BY-NC-SA
Rating
0.0 stars

This case study is based on exercises developed by Dave Pollard and uses images and mapping from Delaney and Pollard (1981). Students explore mechanisms of dike emplacement by measuring dike thicknesses along two segments of a dike intruded into shale near Ship Rock, New Mexico and mapped by Paul Delaney. Students then compare the observed dike profiles to a mechanical model -- the solution for a crack filled with magma under uniform pressure. Using the equation for opening of the crack students estimate the driving stress (difference between the magma pressure and remote principal stress acting perpendicular to the dike plane) using several different estimates of the rock stiffness parameters. Students are then asked to observe how well their best-fit model fits the two dike profiles and to investigate the map further and hypothesize why the observed widths may deviate from the simple model. Deviations from the mechanical model can lead to discussions on mechanical interaction as well as brecciation and stoping.

(Note: this resource was added to OER Commons as part of a batch upload of over 2,200 records. If you notice an issue with the quality of the metadata, please let us know by using the 'report' button and we will flag it for consideration.)

Subject:
Biology
Life Science
Mathematics
Measurement and Data
Statistics and Probability
Material Type:
Activity/Lab
Case Study
Provider:
Science Education Resource Center (SERC) at Carleton College
Provider Set:
Teach the Earth
Author:
Phil Resor
Date Added:
08/18/2019
Crafting a Sustainability Message
Conditional Remix & Share Permitted
CC BY-NC-SA
Rating
0.0 stars

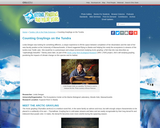
Students will do background reading and research local energy production, historical patterns, and alternative energy possibilities for this area. Their task is to create a display board that can convey their research and promote education about local energy production to k-12 students. The message must also convey opportunities for youth in energy-related fields by staying in school.

(Note: this resource was added to OER Commons as part of a batch upload of over 2,200 records. If you notice an issue with the quality of the metadata, please let us know by using the 'report' button and we will flag it for consideration.)
Subject:
Biology
Life Science
Material Type:
Lesson Plan
Provider:
Science Education Resource Center (SERC) at Carleton College
Provider Set:
Teach the Earth
Author:
Martha Henderson
Date Added:
08/11/2019
Crandall Canyon Mine Collapse, Utah: Case Example
Conditional Remix & Share Permitted
CC BY-NC-SA
Rating
0.0 stars

Students evaluate whether pillar failure and collapse caused ground shaking or whether an earthquake caused pillar failure and mine collapse in the Crandall Canyon Mine collapse in 2007.

(Note: this resource was added to OER Commons as part of a batch upload of over 2,200 records. If you notice an issue with the quality of the metadata, please let us know by using the 'report' button and we will flag it for consideration.)
Subject:
Biology
Life Science
Material Type:
Activity/Lab
Provider:
Science Education Resource Center (SERC) at Carleton College
Provider Set:
Teach the Earth
Author:
Barb Tewksbury
Date Added:
08/09/2019
The Crash Scene
Read the Fine Print
Educational Use
Rating
0.0 stars

In this lesson, students find their location on a map using Latitude and Longitudinal coordinates. They determine where they should go to be rescued and how best to get there.

Subject:
Applied Science
Ecology
Engineering
Forestry and Agriculture
Geoscience
Life Science
Physical Science
Material Type:
Activity/Lab
Lesson Plan
Provider:
TeachEngineering
Provider Set:
TeachEngineering
Date Added:
09/18/2014
Crater Counting Lab exercise
Conditional Remix & Share Permitted
CC BY-NC-SA
Rating
0.0 stars

This lab focuses on the identification of impact features, and how they can used to estimate the age of planetary surfaces. Key comcepts include understanding how the crater process has changed over geologic time; how those changes manifest themselves in the surficial record of planetary landforms; how other planetary processes modify surficial landforms; how the conditions of the Solar System have changed over time.

(Note: this resource was added to OER Commons as part of a batch upload of over 2,200 records. If you notice an issue with the quality of the metadata, please let us know by using the 'report' button and we will flag it for consideration.)

Subject:
Biology
Geology
Life Science
Physical Science
Material Type:
Activity/Lab
Provider:
Science Education Resource Center (SERC) at Carleton College
Provider Set:
Teach the Earth
Author:
Kevin Mullins
Date Added:
09/30/2022