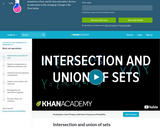
Sal shows examples of intersection and union of sets and introduces some set notation.
- Subject:
- Mathematics
- Statistics and Probability
- Material Type:
- Lesson
- Provider:
- Khan Academy
- Author:
- Salman Khan
- Date Added:
- 12/29/2017

Sal shows examples of intersection and union of sets and introduces some set notation.

Lección de introducción al estudio de la estadística descriptiva.

This course provides graduate students in the sciences with an intensive introduction to applied statistics. Topics include descriptive statistics, probability, non-parametric methods, estimation methods, hypothesis testing, correlation and linear regression, simulation, and robustness considerations. Calculations will be done using handheld calculators and the Minitab Statistical Computer Software.
Word Count: 72364
(Note: This resource's metadata has been created automatically by reformatting and/or combining the information that the author initially provided as part of a bulk import process.)

Short Description:
Welcome to "Introduction to Business Statistics: Northern Canadian Edition". This textbook is specifically designed for students and professionals in the Canadian North who are interested in learning the fundamentals of business statistics. As you know, the Canadian North presents unique challenges and opportunities for business owners and managers. Understanding business statistics is critical for making informed decisions that can lead to success in this region. You will find numerous real-world examples that illustrate the application of statistical concepts in the context of northern Canadian businesses. These examples cover a wide range of industries that will help you develop your skills and reinforce your understanding of the material. By the end of this course, you will have a solid foundation in business statistics and will be well-equipped to apply these skills to real-world business problems. Whether you are a student or a professional, this material will help you make informed decisions and achieve success in the Canadian North. These ancillary materials relate to material covered in Introductory Business Statistics: OpenStax.
Long Description:
Welcome to “Introduction to Business Statistics: Northern Canadian Edition”. This textbook is specifically designed for students and professionals in the Canadian North who are interested in learning the fundamentals of business statistics. As you know, the Canadian North presents unique challenges and opportunities for business owners and managers. Understanding business statistics is critical for making informed decisions that can lead to success in this region. You will find numerous real-world examples that illustrate the application of statistical concepts in the context of northern Canadian businesses. These examples cover a wide range of industries that will help you develop your skills and reinforce your understanding of the material. By the end of this course, you will have a solid foundation in business statistics and will be well-equipped to apply these skills to real-world business problems. Whether you are a student or a professional, this material will help you make informed decisions and achieve success in the Canadian North.
Word Count: 11358
(Note: This resource's metadata has been created automatically by reformatting and/or combining the information that the author initially provided as part of a bulk import process.)

This is a short project that can be used in-class or as homework. It involves just a few questions and it is intended to help students understand the idea of Gibbs free energy. It cannot completely stand alone. I use it after I have talked about Gibbs free energy for 20 minutes. It helps clarify my lecture.
(Note: this resource was added to OER Commons as part of a batch upload of over 2,200 records. If you notice an issue with the quality of the metadata, please let us know by using the 'report' button and we will flag it for consideration.)

This lesson centers around the How AI Works: What is Machine Learning? video from the How AI Works video series. Watch this video first before exploring the lesson plan.
In this lesson students are introduced to a form of artificial intelligence called machine learning and how they can use the Problem Solving Process to help train a robot to solve problems. They participate in three machine learning activities where a robot - AI Bot - is learning how to detect patterns in fish.
This lesson can be taught on its own, or as part of a 7-lesson sequence on How AI Works. Duration: 45 minutes

This is the website for Introduction to Modern Statistics, First Edition by Mine Çetinkaya-Rundel and Johanna Hardin. Introduction to Modern Statistics, which we’ll refer to as IMS going forward, is a textbook from the OpenIntro project.
—
Copyright © 2021.
First Edition.
Version date: June 27, 2021.
This textbook and its supplements, including slides, labs, and interactive tutorials, may be downloaded for free at
openintro.org/book/ims.
This textbook is a derivative of OpenIntro Statistics 4th Edition and Introduction to Statistics with Randomization and Simulation 1st Edition by Diez, Barr, and Çetinkaya-Rundel, and it’s available under a Creative Commons Attribution-ShareAlike 3.0 Unported United States License. License details are available at the Creative Commons website: creativecommons.org.
Source files for this book may be found on GitHub at github.com/openintrostat/ims.

Open Code is a tool for coding and categorizing qualitative data. Open Code 4.0 is a tool to help you index and sort big materials, so it can be searched and re-arranged for further analysis. Open Code was developed to follow the first steps of Grounded Theory but it is now possible to use it for all qualitative methods and it is prepared for Grounded Theory and Qualitative Content analysis. It is useful for sorting and classifying any kind of qualitative information. The software is developed to run on Windows. To run it on a Mac, you have to run a virtual machine or other systems to run pc-software on a mac computer.

How to create a project in Open Code 4. How to import documents to prepare for an analysis. Each project is an database of documents. The analysis is an intellectual process, done outside of Open Code. Open Code is a tool for coding and categorizing qualitative data. Open Code is a tool to help you index and sort big materials, so it can be searched and re-arrangede for furhter analysis. Open Code was developed to follow the first steps of Grounded Theory but it is now possible to use it for all qualitative methods and it is prepared for Grounded Theory and Qualitative Content analysis. It is useful for sorting and classifying any kind of qualitative information. The software is developed to run on Windows. To run it on a Mac, you have to run a virtual machine or other systems to run pc-software on a mac computer.

How to work in the documents in Open Code, showing the interface and ways to work through your project. Open Code is a tool for coding and categorizing qualitative data. Open Code is a tool to help you index and sort big materials, so it can be searched and re-arrangede for furhter analysis. Open Code was developed to follow the first steps of Grounded Theory but it is now possible to use it for all qualitative methods and it is prepared for Grounded Theory and Qualitative Content analysis. It is useful for sorting and classifying any kind of qualitative information. The software is developed to run on Windows. To run it on a Mac, you have to run a virtual machine or other systems to run pc-software on a mac computer.

This is an introduction to probability theory, designed for self-study. It covers the same topics as the one-semester introductory courses which I taught at the University of Minnesota, with some extra discussion for reading on your own. The reasons which underlie the rules of probability are emphasized. Probability theory is certainly useful. But how does it feel to study it? Well, like other areas of mathematics, probability theory contains elegant concepts, and it gives you a chance to exercise your ingenuity, which is often fun. But in addition, randomness and probability are part of our experience in the real world, present everywhere and yet still somewhat mysterious. This gives the subject of probability a special interest.
lecture slides for a calculus-based course in Introduction to Probability & Statistics; suitable for sophomore or junior level of an undergraduate program

Word Count: 3113
(Note: This resource's metadata has been created automatically by reformatting and/or combining the information that the author initially provided as part of a bulk import process.)
The shell of a syllabus that hopes to incorporate many antiracist practices, in statistics.
This work has been superseded by Introduction to Statistics in the Psychological Sciences available from https://irl.umsl.edu/oer/25/.
-
We are constantly bombarded by information, and finding a way to filter that information in an objective way is crucial to surviving this onslaught with your sanity intact. This is what statistics, and logic we use in it, enables us to do. Through the lens of statistics, we learn to find the signal hidden in the noise when it is there and to know when an apparent trend or pattern is really just randomness. The study of statistics involves math and relies upon calculations of numbers. But it also relies heavily on how the numbers are chosen and how the statistics are interpreted.
This work was created as part of the University of Missouri’s Affordable and Open Access Educational Resources Initiative (https://www.umsystem.edu/ums/aa/oer). The contents of this work have been adapted from the following Open Access Resources: Online Statistics Education: A Multimedia Course of Study (http://onlinestatbook.com/). Project Leader: David M. Lane, Rice University. Changes to the original works were made by Dr. Garett C. Foster in the Department of Psychological Sciences to tailor the text to fit the needs of the introductory statistics course for psychology majors at the University of Missouri – St. Louis. Materials from the original sources have been combined, reorganized, and added to by the current author, and any conceptual, mathematical, or typographical errors are the responsibility of the current author.

Presentation on basic sampling methods used in survey design.
The target audience for this book is college students who are required to learn statistics, students with little background in mathematics and often no motivation to learn more. It is assumed that the students do have basic skills in using computers and have access to one. Moreover, it is assumed that the students are willing to actively follow the discussion in the text, to practice, and more importantly, to think.

The book is intended as an upper level undergraduate or introductory graduate textbook in statistical thinking with a likelihood emphasis for students with a good knowledge of calculus and the ability to think abstractly. By "statistical thinking" is meant a focus on ideas that statisticians care about as opposed to technical details of how to put those ideas into practice. The book does contain technical details, but they are not the focus. By "likelihood emphasis" is meant that the likelihood function and likelihood principle are unifying ideas throughout the text.
Another unusual aspect is the use of statistical software as a pedagogical tool. That is, instead of viewing the computer merely as a convenient and accurate calculating device, the book uses computer calculation and simulation as another way of explaining and helping readers understand the underlying concepts. The book is written with the statistical language R embedded throughout. R and accompanying manuals are available for free download from http://www.r-project.org.
Introduction to Statistics is a resource for learning and teaching introductory statistics. This work is in the public domain. Therefore, it can be copied and reproduced without limitation. However, we would appreciate a citation where possible. Please cite as: Online Statistics Education: A Multimedia Course of Study (http://onlinestatbook.com/). Project Leader: David M. Lane, Rice University. Instructor's manual, PowerPoint Slides, and additional questions are available.