Updating search results...

Search Resources

544 Results

View
Selected filters:
Undergraduate Thesis Tutorial
Conditional Remix & Share Permitted
CC BY-NC-SA
Rating
0.0 stars

This course is a series of lectures on prospectus and thesis writing. It is a required course for undergraduate Nuclear Science and Engineering majors, taken during the fall semester of their senior year. Students select a thesis topic and a thesis advisor who reviews and approves the prospectus for thesis work in the subsequent spring term.

Subject:
Applied Science
Arts and Humanities
Engineering
Environmental Science
Literature
Material Type:
Full Course
Provider Set:
MIT OpenCourseWare
Author:
Kokernak, Jane
Sherratt, Christine
Short, Michael
Date Added:
09/01/2015
Understanding the Air through Data Analysis
Read the Fine Print
Educational Use
Rating
0.0 stars

Students build on their existing air quality knowledge and a description of a data set to each develop a hypothesis around how and why air pollutants vary on a daily and seasonal basis. Then they are guided by a worksheet through an Excel-based analysis of the data. This includes entering formulas to calculate statistics and creating plots of the data. As students complete each phase of the analysis, reflection questions guide their understanding of what new information the analysis reveals. At activity end, students evaluate their original hypotheses and “put all of the pieces together.” The activity includes one carbon dioxide worksheet/data set and one ozone worksheet/data set; providing students and/or instructors with a content option. The activity also serves as a good standalone introduction to using Excel.

Subject:
Atmospheric Science
Physical Science
Material Type:
Activity/Lab
Provider:
TeachEngineering
Provider Set:
TeachEngineering
Author:
Ashley Collier
Ben Graves
Daniel Knight
Drew Meyers
Eric Ambos
Eric Lee
Erik Hotaling
Hanadi Adel Salamah
Joanna Gordon
Katya Hafich
Michael Hannigan
Nicholas VanderKolk
Olivia Cecil
Victoria Danner
Date Added:
02/17/2017
The Unicode cookbook for linguists: Managing writing systems using orthography profiles
Unrestricted Use
CC BY
Rating
0.0 stars

This text is a practical guide for linguists, and programmers, who work with data in multilingual computational environments. We introduce the basic concepts needed to understand how writing systems and character encodings function, and how they work together at the intersection between the Unicode Standard and the International Phonetic Alphabet. Although these standards are often met with frustration by users, they nevertheless provide language researchers and programmers with a consistent computational architecture needed to process, publish and analyze lexical data from the world's languages. Thus we bring to light common, but not always transparent, pitfalls which researchers face when working with Unicode and IPA. Having identified and overcome these pitfalls involved in making writing systems and character encodings syntactically and semantically interoperable (to the extent that they can be), we created a suite of open-source Python and R tools to work with languages using orthography profiles that describe author- or document-specific orthographic conventions. In this cookbook we describe a formal specification of orthography profiles and provide recipes using open source tools to show how users can segment text, analyze it, identify errors, and to transform it into different written forms for comparative linguistics research.

Subject:
Applied Science
Computer Science
Linguistics
Social Science
Material Type:
Textbook
Provider:
Language Science Press
Author:
Michael Cysouw
Steven Moran
Date Added:
11/13/2018
Unit 1: Data Set Analysis
Conditional Remix & Share Permitted
CC BY-NC-SA
Rating
0.0 stars

In this unit, students will be introduced to different data types used in the geosciences and other disciplines to understand environmental problems. The instructor will discuss the difference between qualitative and quantitative. Then, students will be given data sets related to water in Phoenix, Arizona. Students will work in groups of two to five to categorize different data sets as qualitative or quantitative and to reflect on their emotive responses to different data. The session ends with a discussion about the potential uses of these various data sets in decision-making around water in Phoenix, and uses this to foster a discussion about the ways in which different data sources lend insight into complex system problems.

(Note: this resource was added to OER Commons as part of a batch upload of over 2,200 records. If you notice an issue with the quality of the metadata, please let us know by using the 'report' button and we will flag it for consideration.)

Subject:
Biology
Career and Technical Education
Environmental Studies
Geology
Life Science
Mathematics
Measurement and Data
Physical Science
Social Science
Sociology
Statistics and Probability
Material Type:
Activity/Lab
Module
Provider:
Science Education Resource Center (SERC) at Carleton College
Provider Set:
Teach the Earth
Author:
Kate Darby
Lisa Phillips
Michael Phillips
Date Added:
04/22/2021
Unit 2: Sensory Log & Holistic Reflection
Conditional Remix & Share Permitted
CC BY-NC-SA
Rating
0.0 stars

In this unit, students will keep a log of immediate, personal sensory experiences by pausing once each hour over a period of ten hours and recording the sights, sounds, smells, tastes, and tactile experiences they are sensing at that moment. The log (or journaling activity) will occur outside of class and will be shared in a subsequent class meeting.
In class, students will exchange their logs, respond and discuss, and then form larger groups which will discuss disparate ways of paying attention to sensory experiences. Students will develop a deeper understanding of their own perceptions and how those perceptions can be recorded and used to evaluate an environmental setting. This activity is qualitative; it requires students to create an informal, subjective journal of their sensory experiences once each hour for a ten-hour time period prior to class.
When students share their individual qualitative experiences in pairs and small groups, they will begin to see patterns emerge that will enable them to develop quantitative observations for future use. They will also begin to relate their sensory experiences to the social, biological, and geophysical aspects of their personal environment; students will begin to explore how these system components are interrelated and how exposure to them may impact human experience and well-being. After the group discussion, students will reflect on the interstices between qualitative and quantitative analysis by way of their sensory logs and mutual discussion.

(Note: this resource was added to OER Commons as part of a batch upload of over 2,200 records. If you notice an issue with the quality of the metadata, please let us know by using the 'report' button and we will flag it for consideration.)
Subject:
Biology
Career and Technical Education
Environmental Studies
Geology
Life Science
Mathematics
Measurement and Data
Physical Science
Social Science
Sociology
Material Type:
Activity/Lab
Module
Provider:
Science Education Resource Center (SERC) at Carleton College
Provider Set:
Teach the Earth
Author:
Kate Darby
Lisa Phillips
Michael Phillips
Date Added:
09/29/2022
Unit 3: Sensory Data Collection
Conditional Remix & Share Permitted
CC BY-NC-SA
Rating
0.0 stars

In this unit, students will develop protocols for the collection of sensory data (scents and/or sounds), plan and execute the field collection of sensory data using developed protocols, analyze collected data, and create a map that communicates findings and impacts on the local population.
The advantage of using sensory data is that students are equipped with the analytical equipment (ears and nose) and are familiar with its use. However, students may not have taken the time to consider the variety of perceptions that occur within a group of people who are sharing a sensory experience and the impact that variation can have when collecting and analyzing data and subsequently communicating the results.
In this unit, as in the entire module, sensory data is considered in two contexts: First, as an indicator of environmental conditions, and, in some instances, environmental disruption. Second, as a proxy for data that is not as easily collected or as readily analyzed such as air or water samples. One of the challenges of developing these protocols will be discerning individual components from a complex system and developing an approach for systematically recording these data. This, though, gives students important exposure to the challenges of understanding and characterizing today's societal problems, which tend to include many interrelated dynamic causes.

(Note: this resource was added to OER Commons as part of a batch upload of over 2,200 records. If you notice an issue with the quality of the metadata, please let us know by using the 'report' button and we will flag it for consideration.)
Subject:
Applied Science
Biology
Career and Technical Education
Environmental Studies
Geology
Health, Medicine and Nursing
Life Science
Mathematics
Measurement and Data
Physical Science
Material Type:
Activity/Lab
Module
Provider:
Science Education Resource Center (SERC) at Carleton College
Provider Set:
Teach the Earth
Author:
Kate Darby
Lisa Phillips
Michael Phillips
Date Added:
09/29/2022
Unit 4: Case Study Analysis
Conditional Remix & Share Permitted
CC BY-NC-SA
Rating
0.0 stars

In this unit, student groups will evaluate different environmental case studies to critically investigate qualitative and quantitative data analysis, collection, and inquiry. Students will begin to consider different forms of sensory-related data collection and how experiential knowledge informs the ways in which one forms analytical, evaluative questions. Student expert groups are provided one case study (different expert groups will examine at least two different cases) that has a number of different kinds of resources that students will examine (e.g. journalistic, scientific, narrative, visual, auditory). Students will use cooperative learning methods to engage with problem-based inquiry rather than have the case study information delivered via instructor-based lecture. Given that students across disciplinary contexts may not have been exposed to scientific methods of investigation, this unit encourages systems thinking alongside other methods of investigation. As students consider the variety of perceptions that occur within a group of people sharing an environmental experience, students are able to consider the impact that different types of data have on one's perception of data collection and its analysis. This exercise also demonstrates the utility of interdisciplinary thinking -- by examining data sets from multiple academic disciplines, students gain a more complete understanding of the case study compared to what they would have understood by examining data from a single research approach. The activity also provides students with an opportunity to practice interdisciplinary thinking and collaboration skills. The cases address several key environmental challenges: soil contamination, water resources, and the impacts of industrial agriculture.
A collaborative learning method is used in conjunction with guided class and group discussion to critically examine different types of data and encourage consistency of data analysis between student groups. This unit uses a group exploration and presentation activity to ensure equal distribution of materials and accountability among class participants. In essence, the students teach each other about the case studies with the instructor providing questions to elicit depth and synthesis between groups as well as to ensure that critical data analysis is undertaken.

(Note: this resource was added to OER Commons as part of a batch upload of over 2,200 records. If you notice an issue with the quality of the metadata, please let us know by using the 'report' button and we will flag it for consideration.)
Subject:
Applied Science
Environmental Science
Material Type:
Activity/Lab
Case Study
Module
Provider:
Science Education Resource Center (SERC) at Carleton College
Provider Set:
Teach the Earth
Author:
Kate Darby
Lisa Phillips
Michael Phillips
Date Added:
09/29/2022
Unit 5: Sensory Map Development
Conditional Remix & Share Permitted
CC BY-NC-SA
Rating
0.0 stars

In this unit, student groups will use sensory data (scents and/or sounds) collected in the field to create maps of the sensory environment and relate their findings to larger environmental problems identified in their guiding questions and hypotheses. This unit is designed to build upon prior units in which students develop guiding questions and hypotheses, field data collection protocols, and field investigation plans. The field investigation will require a base map on which to record data and a final map on which to display data and characterize the study area and environmental impact of the mapped data. The base map will be derived from aerial imagery if the investigation site is outside. The base map will be derived from a building schematic or floor map if an interior location is mapped.
Class time will be devoted to developing maps on which students will display the data collected in the field. Students will use Google Earth or other online resources to obtain aerial (or other schematic) imagery of their study area. They may use an aerial image as a base map or they may draw their own maps based on the aerial imagery. If the site is indoors, a blueprint or floor plan can be the base map, or students can draw their own maps based on an existing image or schematic.
Sensory mapping allows students to identify scent plumes as they migrate away from source locations. Odor plumes and sounds are analogous to plumes of contaminants that migrate through groundwater, surface water, and air. In many instances, the presence of unusual odors is an indicator of migrating contaminants and can lead to sampling by environmental professionals (including geoscientists) to confirm and quantify contaminant migration through the environment. These maps serve as representations of the complex odor or sound systems in the students' chosen geographical areas.

(Note: this resource was added to OER Commons as part of a batch upload of over 2,200 records. If you notice an issue with the quality of the metadata, please let us know by using the 'report' button and we will flag it for consideration.)
Subject:
Applied Science
Environmental Science
Material Type:
Activity/Lab
Module
Provider:
Science Education Resource Center (SERC) at Carleton College
Provider Set:
Teach the Earth
Author:
Kate Darby
Lisa Phillips
Michael Phillips
Date Added:
09/29/2022
The Unix Shell
Unrestricted Use
CC BY
Rating
0.0 stars

Software Carpentry lesson on how to use the shell to navigate the filesystem and write simple loops and scripts. The Unix shell has been around longer than most of its users have been alive. It has survived so long because it’s a power tool that allows people to do complex things with just a few keystrokes. More importantly, it helps them combine existing programs in new ways and automate repetitive tasks so they aren’t typing the same things over and over again. Use of the shell is fundamental to using a wide range of other powerful tools and computing resources (including “high-performance computing” supercomputers). These lessons will start you on a path towards using these resources effectively.

Subject:
Applied Science
Computer Science
Mathematics
Measurement and Data
Material Type:
Module
Provider:
The Carpentries
Author:
Adam Huffman
Adam James Orr
Adam Richie-Halford
AidaMirsalehi
Alex Kassil
Alex Mac
Alexander Konovalov
Alexander Morley
Alix Keener
Amy Brown
Andrea Bedini
Andrew Boughton
Andrew Reid
Andrew T. T. McRae
Andrew Walker
Ariel Rokem
Armin Sobhani
Ashwin Srinath
Bagus Tris Atmaja
Bartosz Telenczuk
Ben Bolker
Benjamin Gabriel
Bertie Seyffert
Bill Mills
Brian Ballsun-Stanton
BrianBill
Camille Marini
Chris Mentzel
Christina Koch
Colin Morris
Colin Sauze
Damien Irving
Dan Jones
Dana Brunson
Daniel Baird
Daniel McCloy
Daniel Standage
Danielle M. Nielsen
Dave Bridges
David Eyers
David McKain
David Vollmer
Dean Attali
Devinsuit
Dmytro Lituiev
Donny Winston
Doug Latornell
Dustin Lang
Elena Denisenko
Emily Dolson
Emily Jane McTavish
Eric Jankowski
Erin Alison Becker
Ethan P White
Evgenij Belikov
Farah Shamma
Fatma Deniz
Filipe Fernandes
Francis Gacenga
François Michonneau
Gabriel A. Devenyi
Gerard Capes
Giuseppe Profiti
Greg Wilson
Halle Burns
Hannah Burkhardt
Harriet Alexander
Hugues Fontenelle
Ian van der Linde
Inigo Aldazabal Mensa
Jackie Milhans
Jake Cowper Szamosi
James Guelfi
Jan T. Kim
Jarek Bryk
Jarno Rantaharju
Jason Macklin
Jay van Schyndel
Jens vdL
John Blischak
John Pellman
John Simpson
Jonah Duckles
Jonny Williams
Joshua Madin
Kai Blin
Kathy Chung
Katrin Leinweber
Kevin M. Buckley
Kirill Palamartchouk
Klemens Noga
Kristopher Keipert
Kunal Marwaha
Laurence
Lee Zamparo
Lex Nederbragt
M Carlise
Mahdi Sadjadi
Marc Rajeev Gouw
Marcel Stimberg
Maria Doyle
Marie-Helene Burle
Marisa Lim
Mark Mandel
Martha Robinson
Martin Feller
Matthew Gidden
Matthew Peterson
Megan Fritz
Michael Zingale
Mike Henry
Mike Jackson
Morgan Oneka
Murray Hoggett
Nicola Soranzo
Nicolas Barral
Noah D Brenowitz
Noam Ross
Norman Gray
Orion Buske
Owen Kaluza
Patrick McCann
Paul Gardner
Pauline Barmby
Peter R. Hoyt
Peter Steinbach
Philip Lijnzaad
Phillip Doehle
Piotr Banaszkiewicz
Rafi Ullah
Raniere Silva
Robert A Beagrie
Ruud Steltenpool
Ry4an Brase
Rémi Emonet
Sarah Mount
Sarah Simpkin
Scott Ritchie
Stephan Schmeing
Stephen Jones
Stephen Turner
Steve Leak
Stéphane Guillou
Susan Miller
Thomas Mellan
Tim Keighley
Tobin Magle
Tom Dowrick
Trevor Bekolay
Varda F. Hagh
Victor Koppejan
Vikram Chhatre
Yee Mey
csqrs
earkpr
ekaterinailin
nther
reshama shaikh
s-boardman
sjnair
Date Added:
03/20/2017
Urban Design Studio: Providence
Conditional Remix & Share Permitted
CC BY-NC-SA
Rating
0.0 stars

This studio discusses in great detail the design of urban environments, specifically in Providence, RI. It will propose strategies for change in large areas of cities, to be developed over time, involving different actors. Fitting forms into natural, man-made, historical, and cultural contexts; enabling desirable activity patterns; conceptualizing built form; providing infrastructure and service systems; guiding the sensory character of development: all are topics covered in the studio. The course integrates architecture and planning students in joint work and requires individual designs and planning guidelines as a final product.

Subject:
Applied Science
Architecture and Design
Social Science
Material Type:
Full Course
Provider Set:
MIT OpenCourseWare
Author:
Dennis, Michael
Morrow, Greg
Date Added:
02/01/2005
Urban Housing: Paris, London, New York
Conditional Remix & Share Permitted
CC BY-NC-SA
Rating
0.0 stars

This class presents an analysis of the development of housing models and their urban implications in Paris, London, and New York City from the seventeenth century to the present. The focus will be on three models: the French hotel, the London row house, and the New York City tenement and apartment building. Other topics covered will include twentieth-century housing reform movements and work by the London County Council, CIAM, and American public housing agencies.

Subject:
Social Science
Material Type:
Full Course
Provider Set:
MIT OpenCourseWare
Author:
Dennis, Michael
Date Added:
09/01/2004
Urheberrechte Hochschullehre ab 1.1.2017
Conditional Remix & Share Permitted
CC BY-SA
Rating
0.0 stars

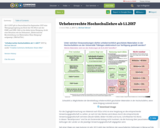
Ab 1.1.2017 gilt in Deutschland bis September 2017 eine Übergangsregelung im Streit der VG Wort mit der KMK und HRK. Gibt es bis dahin keine Einigung, droht eine Situation wie im Dokument „Elektronische Bereitstellung von Materialien Ohne Einigung“ aufgezeigt. ( BibUniTüb )

Subject:
Education
Material Type:
Diagram/Illustration
Date Added:
02/01/2017
Using "Dante's Peak" to Discuss Response to Risk
Conditional Remix & Share Permitted
CC BY-NC-SA
Rating
0.0 stars

In this classroom activity, students watch the movie "Dante's Peak" up to the point where Harry Dalton's supervisor arrives and talks to the town council. Students then compare and contrast Harry's assessment and advice to that of his supervisor, discuss the reaction of the town council members, and develop their own recommendations for how the scientists and town should proceed.

(Note: this resource was added to OER Commons as part of a batch upload of over 2,200 records. If you notice an issue with the quality of the metadata, please let us know by using the 'report' button and we will flag it for consideration.)
Subject:
Applied Science
Biology
Career and Technical Education
Environmental Studies
Geology
Health, Medicine and Nursing
Life Science
Physical Science
Material Type:
Activity/Lab
Provider:
Science Education Resource Center (SERC) at Carleton College
Provider Set:
Teach the Earth
Author:
Michael Phillips
Date Added:
09/10/2020
VEPP: Monitoring the Pu'u 'Ō'ō Eruption of Kīlauea Volcano Using Geochemical, Deformation and Seismicity Timeseries Data
Conditional Remix & Share Permitted
CC BY-NC-SA
Rating
0.0 stars

Show credits
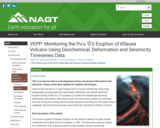
HidePu'u 'O'o at the end of episode 32 (USGS photograph by J.D. Griggs, 4/22/85, JG5363).
This is an exercise that is in development and has not yet been fully tested in the classroom. Please check back regularly for updates and changes.

Goals of this lab are to: (1) gain background on volcano monitoring using maps, photographs, and geochemical, deformation (tiltmeter) and seismic data from eruptive activity of the Pu'u 'Ō'ō eruption; (2) make and interpret geochemical, deformation and seismic data plots as part of a time-series analysis for particular intervals of eruptive activity; and (3) answer questions and discuss information about magmatic and structural processes associated with volcanism at Kīlauea Volcano.

Brief description of the activity

The current eruption of Kīlauea Volcano on the island of Hawai'i has been closely monitored and studied since its inception in 1983. This laboratory exercise utilizes the excitement of an ongoing eruption to demonstrate volcano monitoring, deformation, and magmatic processes to better understand an active hotspot volcano.

(Note: this resource was added to OER Commons as part of a batch upload of over 2,200 records. If you notice an issue with the quality of the metadata, please let us know by using the 'report' button and we will flag it for consideration.)
Subject:
Biology
Chemistry
Life Science
Physical Science
Material Type:
Activity/Lab
Provider:
Science Education Resource Center (SERC) at Carleton College
Provider Set:
Teach the Earth
Author:
Andrew R. Greene and Michael O. Garcia, University of Hawai'i at Mānoa
Date Added:
03/28/2018
VEPP: Volcano Monitoring and Interpretation of Real-Time Data: A Project for Non-Science Majors
Conditional Remix & Share Permitted
CC BY-NC-SA
Rating
0.0 stars

This is an exercise that is in development and has not yet been fully tested in the classroom. Please check back regularly for updates and changes.

An ongoing project for small class size comprised of non-science majors. Students use the VEPP website as a monitoring tool to document and interpret real-time volcanic deformation data at Pu'u 'O'o and determine whether an eruptive event is occurring. They also incorporate past events at Kilauea/Pu'u 'O'o as models.

Full length description:

This project should be started midway into the semester or quarter, continuing until the end of the semester (students must first have enough background in geology/volcanology before they can tackle this project successfully, so lectures on magmatic differentiation, types of volcanism- explosive vs effusive, and targeted activities need to precede the start of the project). Students need to know how to read the data on the VEPP website- if classroom wi-fi is available and most students have laptops, instruction on navigation and interpretation can take place in the classroom; if not, a computer lab may be required for at least one class session. However, a large part of familiarizing students with the website can also be accomplished lecture-style by the instructor logging on in a 'smart' classroom.

Students should be divided into three (or some suitable number of) groups: each group will be responsible for reporting weekly on a specific monitoring technique (tilt, seismic, GPS), retrieving and interpreting their information from VEPP/VALVE website. Additional information including updates, past information and geology may be obtained from the USGS Hawaiian Volcano Observatory website.

Students will report current deformation information each week in a "Monday morning meeting" format- each of the three groups will pass out a brief written summary on the data they are responsible for, and give an oral report with questions from the other two groups to follow each presentation. Team spokespersons will rotate every week. Each group will touch on potential sources of error associated with their particular monitoring technique, and attempt to differentiate between real information and what might be extraneous "noise". Groups should be given a short time to confer in class before they present, but prior outside group meetings will be essential to a successful weekly presentation.

At the end of the three group presentations, the instructor should moderate a general discussion by all in an attempt to have the groups integrate their data (i.e., does one data set support another? Is there disparity? What conclusions can be drawn from this particular week's information, and how does it seem to fit, both short-term and long-term?). Instructor may introduce other information sources, like live webcam photos and/or a discussion of past history, to offer support, or lack of support, for a specific interpretation of data being presented by a team or teams (HVO website is a great resource for this).

As the semester proceeds, each of the groups plot their data on a large graph situated in the front of the class. We'll use both graphical plots and location maps to pinpoint events if they occur. Lectures will incorporate other tools to hopefully enhance and lend credence to the interpretation process- use of geologic observations, gas emissions and other information, the main reference source being the HVO website. Past Kilauea/Pu'u 'O'o events will need to be examined for comparison purposes.

This exercise is meant to simulate some of the tasks that volcanologists undertake in the real world.

(Note: this resource was added to OER Commons as part of a batch upload of over 2,200 records. If you notice an issue with the quality of the metadata, please let us know by using the 'report' button and we will flag it for consideration.)
Subject:
Biology
Life Science
Physical Science
Physics
Material Type:
Activity/Lab
Provider:
Science Education Resource Center (SERC) at Carleton College
Provider Set:
Teach the Earth
Author:
Michael Johnson
Date Added:
11/15/2016
Vector Addition
Unrestricted Use
CC BY
Rating
0.0 stars

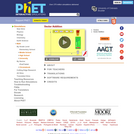
Learn how to add vectors. Drag vectors onto a graph, change their length and angle, and sum them together. The magnitude, angle, and components of each vector can be displayed in several formats.

Subject:
Mathematics
Material Type:
Simulation
Provider:
University of Colorado Boulder
Provider Set:
PhET Interactive Simulations
Author:
Michael Dubson
Mindy Gratny
Date Added:
11/16/2007
Vector Addition (AR)
Unrestricted Use
CC BY
Rating
0.0 stars

Learn how to add vectors. Drag vectors onto a graph, change their length and angle, and sum them together. The magnitude, angle, and components of each vector can be displayed in several formats.

Subject:
Mathematics
Material Type:
Simulation
Provider:
University of Colorado Boulder
Provider Set:
PhET Interactive Simulations
Author:
Michael Dubson
Mindy Gratny
Date Added:
06/17/2011
Vector Calculus
Read the Fine Print
Some Rights Reserved
Rating
0.0 stars

This is a text on elementary multivariable calculus, designed for students who have completed courses in single-variable calculus. The traditional topics are covered: basic vector algebra; lines, planes and surfaces; vector-valued functions; functions of 2 or 3 variables; partial derivatives; optimization; multiple integrals; line and surface integrals.

Subject:
Calculus
Mathematics
Material Type:
Activity/Lab
Homework/Assignment
Textbook
Provider:
Schoolcraft College
Author:
Michael Corral
Date Added:
02/16/2011
Version Control with Git
Unrestricted Use
CC BY
Rating
0.0 stars

This lesson is part of the Software Carpentry workshops that teach how to use version control with Git. Wolfman and Dracula have been hired by Universal Missions (a space services spinoff from Euphoric State University) to investigate if it is possible to send their next planetary lander to Mars. They want to be able to work on the plans at the same time, but they have run into problems doing this in the past. If they take turns, each one will spend a lot of time waiting for the other to finish, but if they work on their own copies and email changes back and forth things will be lost, overwritten, or duplicated. A colleague suggests using version control to manage their work. Version control is better than mailing files back and forth: Nothing that is committed to version control is ever lost, unless you work really, really hard at it. Since all old versions of files are saved, it’s always possible to go back in time to see exactly who wrote what on a particular day, or what version of a program was used to generate a particular set of results. As we have this record of who made what changes when, we know who to ask if we have questions later on, and, if needed, revert to a previous version, much like the “undo” feature in an editor. When several people collaborate in the same project, it’s possible to accidentally overlook or overwrite someone’s changes. The version control system automatically notifies users whenever there’s a conflict between one person’s work and another’s. Teams are not the only ones to benefit from version control: lone researchers can benefit immensely. Keeping a record of what was changed, when, and why is extremely useful for all researchers if they ever need to come back to the project later on (e.g., a year later, when memory has faded). Version control is the lab notebook of the digital world: it’s what professionals use to keep track of what they’ve done and to collaborate with other people. Every large software development project relies on it, and most programmers use it for their small jobs as well. And it isn’t just for software: books, papers, small data sets, and anything that changes over time or needs to be shared can and should be stored in a version control system.

Subject:
Applied Science
Computer Science
Information Science
Mathematics
Measurement and Data
Material Type:
Module
Provider:
The Carpentries
Author:
Alexander G. Zimmerman
Amiya Maji
Amy L Olex
Andrew Lonsdale
Annika Rockenberger
Begüm D. Topçuoğlu
Ben Bolker
Bill Sacks
Brian Moore
Casey Youngflesh
Charlotte Moragh Jones-Todd
Christoph Junghans
David Jennings
Erin Alison Becker
François Michonneau
Garrett Bachant
Grant Sayer
Holger Dinkel
Ian Lee
Jake Lever
James E McClure
James Tocknell
Janoš Vidali
Jeremy Teitelbaum
Jeyashree Krishnan
Jimmy O'Donnell
Joe Atzberger
Jonah Duckles
Jonathan Cooper
João Rodrigues
Katherine Koziar
Katrin Leinweber
Kunal Marwaha
Kurt Glaesemann
L.C. Karssen
Lauren Ko
Lex Nederbragt
Madicken Munk
Maneesha Sane
Marie-Helene Burle
Mark Woodbridge
Martino Sorbaro
Matt Critchlow
Matteo Ceschia
Matthew Bourque
Matthew Hartley
Maxim Belkin
Megan Potterbusch
Michael Torpey
Michael Zingale
Mingsheng Zhang
Nicola Soranzo
Nima Hejazi
Oscar Arbeláez
Peace Ossom Williamson
Pey Lian Lim
Raniere Silva
Rayna Michelle Harris
Rene Gassmoeller
Rich McCue
Richard Barnes
Ruud Steltenpool
Rémi Emonet
Samniqueka Halsey
Samuel Lelièvre
Sarah Stevens
Saskia Hiltemann
Schlauch, Tobias
Scott Bailey
Simon Waldman
Stefan Siegert
Thomas Morrell
Tommy Keswick
Traci P
Tracy Teal
Trevor Keller
TrevorLeeCline
Tyler Crawford Kelly
Tyler Reddy
Umihiko Hoshijima
Veronica Ikeshoji-Orlati
Wes Harrell
Will Usher
Wolmar Nyberg Åkerström
abracarambar
butterflyskip
jonestoddcm
Date Added:
03/20/2017