Updating search results...

Search Resources

1474 Results

View
Selected filters:
  • Geoscience
Estimating Exchange Rates of Water in Embayments using Simple Budget Equations.
Conditional Remix & Share Permitted
CC BY-NC-SA
Rating
0.0 stars

Simple budgets may be used to estimate the exchange of water in embayments that capitalize on the concept of steady state and conservation principals. This is especially true for bays that experience a significant exchange of freshwater. This exchange of freshwater may reduce the average salt concentration in the bay compared to seawater if it involves addition of freshwater from rivers, R, and/or precipitation, P. Alternatively, it may increase the average salt concentration in the bay compared to seawater if there is relatively little river input and high evaporation, E. Since freshwater input changes the salt concentration in the bay, and salt is a conservative material, it is possible to combine two steady state budgets for a bay, one for salt and one for water, to solve for the magnitude of the water flows that enter and exit the bay mouth.
Students will make actual calculations for the inflow and outflow of water to Puget Sound, Washington and the Mediterranean Sea and compare them to actual measured values.

(Note: this resource was added to OER Commons as part of a batch upload of over 2,200 records. If you notice an issue with the quality of the metadata, please let us know by using the 'report' button and we will flag it for consideration.)

Subject:
Biology
Chemistry
Geoscience
Life Science
Mathematics
Measurement and Data
Physical Science
Statistics and Probability
Material Type:
Activity/Lab
Provider:
Science Education Resource Center (SERC) at Carleton College
Provider Set:
Teach the Earth
Author:
Keith Sverdrup
Date Added:
11/24/2020
Estimating Planar Areas Using Analogue Methods
Read the Fine Print
Some Rights Reserved
Rating
0.0 stars

This math problem determines the areas of simple and complex planar figures using measurement of mass and proportional constructs. Materials are inexpensive or easily found (poster board, scissors, ruler, sharp pencil, right angle), but also requires use of an analytical balance (suggestions are provided for working with less precise weighing tools). This resource is from PUMAS - Practical Uses of Math and Science - a collection of brief examples created by scientists and engineers showing how math and science topics taught in K-12 classes have real world applications.

Subject:
Geoscience
Mathematics
Physical Science
Physics
Material Type:
Lecture Notes
Provider:
NASA
Provider Set:
NASA Wavelength
Date Added:
11/05/2014
Estimating Primary Production in the Oceans from Satellite Data
Conditional Remix & Share Permitted
CC BY-NC-SA
Rating
0.0 stars

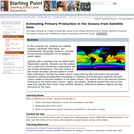
In this computer lab, students use satellite imagery, daylength information, and phytoplankton physiology models to calculate annual primary production for an assigned ocean region.

Satellite data is obtained from the NASA Earth Observation website. Students use the analysis tool to determine chlorophyll concentration and sea surface temperature. They also receive a day-length calculator and are asked to model light transmission through the water column. Using step-by-step instructions and proviede equations relating phytoplankton physiology to irradiance and temperature students calculate carbon uptake at discreet locations in the water column. The second half of the exercise involves scaling up to the entire water column, region, and season. Students present their work to the class and evaluate their result using scientific literature. Differences between regions are then discussed by the class.

(Note: this resource was added to OER Commons as part of a batch upload of over 2,200 records. If you notice an issue with the quality of the metadata, please let us know by using the 'report' button and we will flag it for consideration.)

Subject:
Biology
Chemistry
Geoscience
Life Science
Mathematics
Measurement and Data
Oceanography
Physical Science
Material Type:
Activity/Lab
Data Set
Lesson Plan
Provider:
Science Education Resource Center (SERC) at Carleton College
Provider Set:
Teach the Earth
Author:
Kevin Arrigo
Lindsey Kropuenske
Richa
Date Added:
06/16/2022
Eureka! Or Buoyancy and Archimedes' Principle
Read the Fine Print
Educational Use
Rating
0.0 stars

Students explore material properties in hands-on and visually evident ways via the Archimedes' principle. First, they design and conduct an experiment to calculate densities of various materials and present their findings to the class. Using this information, they identify an unknown material based on its density. Then, groups explore buoyant forces. They measure displacement needed for various materials to float on water and construct the equation for buoyancy. Using this equation, they calculate the numerical solution for a boat hull using given design parameters.

Subject:
Applied Science
Architecture and Design
Engineering
Geoscience
Physical Science
Physics
Material Type:
Activity/Lab
Provider:
TeachEngineering
Provider Set:
TeachEngineering
Author:
Andy Wekin
Date Added:
09/18/2014
Evaporation Investigation
Read the Fine Print
Rating
0.0 stars

This is a hands-on lab activity about evaporation. Learners will conduct experiments to observe the process of evaporation. They will then describe the process of evaporation, and the general water cycle, through discussion and pictures. Background information, common preconceptions, a glossary and more is included. This activity is part of the Aquarius Hands-on Laboratory Activities.

Subject:
Geoscience
Oceanography
Physical Science
Physics
Material Type:
Activity/Lab
Lesson Plan
Provider:
NASA
Provider Set:
NASA Wavelength
Date Added:
11/05/2014
Evaporative Cooler
Read the Fine Print
Rating
0.0 stars

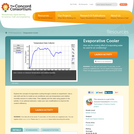
Explore the concept of evaporative cooling through a hands-on experiment. Use a wet cloth and fan to model an air-conditioner and use temperature and relative humidity sensors to collect data. Then digitally plot the data using graphs in the activity. In an optional extension, make your own modifications to improve the cooler's efficiency.

Subject:
Applied Science
Chemistry
Education
Engineering
Geoscience
Mathematics
Physical Science
Physics
Material Type:
Activity/Lab
Diagram/Illustration
Lecture Notes
Provider:
Concord Consortium
Provider Set:
Concord Consortium Collection
Author:
The Concord Consortium
Date Added:
12/12/2011
Eve: Extreme Ultraviolet Variability Experiment
Read the Fine Print
Educational Use
Rating
0.0 stars

In this NASA video, scientists describe how the Extreme Ultraviolet Variability Experiment will sample and track the Sun's ultraviolet irradiance, providing a detailed time sequence of extreme ultraviolet output -- data that can provide advance warning for potentially disruptive energy bursts.

Subject:
Chemistry
Geoscience
Physical Science
Physics
Space Science
Material Type:
Lesson
Provider:
PBS LearningMedia
Provider Set:
PBS Learning Media Common Core Collection
Author:
NASA
WGBH Educational Foundation
WNET
Date Added:
10/28/2011
Event Science: Kilauea Volcano
Conditional Remix & Share Permitted
CC BY-NC
Rating
0.0 stars

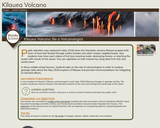
Public attention was captured in May 2018 when the Hawaiian volcano Kīlauea erupted with rivers of lava that flowed through Leilani Estates and other nearby neighborhoods. Your students may have seen videos of hot lava covering roads, destroying homes, or reaching the ocean with clouds of hot steam. You can capitalize on their interest by using data from this real-world event.

In these middle school lessons, students take on the role of volcanologists in order to analyze geologic data about the May 2018 eruption of Kīlauea and provide recommendations for mitigating its harmful effects.

Subject:
Biology
Geoscience
Life Science
Physical Science
Material Type:
Activity/Lab
Interactive
Lesson
Lesson Plan
Unit of Study
Provider:
Learning in Motion
Date Added:
08/28/2018
Evidence for the Big Bang Theory
Read the Fine Print
Educational Use
Rating
0.0 stars

This video segment adapted from NOVA tells the story of two scientists who inadvertently discovered microwave radiation that is now believed to be heat left over from the Big Bang.

Subject:
Astronomy
Geoscience
Physical Science
Space Science
Material Type:
Lecture
Provider:
PBS LearningMedia
Provider Set:
PBS Learning Media: Multimedia Resources for the Classroom and Professional Development
Author:
National Science Foundation
WGBH Educational Foundation
Date Added:
12/17/2005
Evolutionary game theory I
Conditional Remix & Share Permitted
CC BY-SA
Rating
0.0 stars

In the first video segment, we analyze the population dynamics for a test-tube of cells that affect each others' likelihoods of replication when they collide. The particular example we use is a prisoner's dilemma, which has the almost paradoxical property that survival of the relatively most fit leads overall fitness to decrease. In the second video segment, we suggest that the population dynamics from the first segment can be related to an analysis that uses payoff matrices found in traditional game theory.

Subject:
Ecology
Forestry and Agriculture
Geoscience
Life Science
Mathematics
Physical Science
Material Type:
Lecture Notes
Provider:
Look At Physics
Provider Set:
A Mathematical Way to Think About Biology
Author:
David Liao
Date Added:
10/08/2012
Evolution as Reproduction with Variability
Read the Fine Print
Rating
0.0 stars

In this online activity, learners discover how random variation influences biological evolution. Biological evolution is often thought of as a process by which adaptation is generated through selection.Œć While it is recognized that random variation underlies the process, emphasis is usually placed on selection and resulting adaptation, leaving a sense that it is selection that drives evolution.Œć This simulation highlights the creative role of random variation, offering a somewhat different perspective: that of evolution as open-ended exploration driven by randomness and constrained by selection, with adaptation as a dynamic, transient consequence rather than an objective.

Subject:
Anthropology
Geoscience
History
History, Law, Politics
Life Science
Physical Science
Social Science
Material Type:
Activity/Lab
Simulation
Provider:
Serendip Studio
Provider Set:
Minds-On Activities for Teaching Biology
Date Added:
11/09/2012
Evolution of Normal Fault Systems During Progressive Deformation
Conditional Remix & Share Permitted
CC BY-NC-SA
Rating
0.0 stars

Many papers by Ken McClay and colleagues have established the value of scale-model experiments in understanding the evolution and geometries of extensional fault systems (e.g. T. Dooley and K.R. McClay, 1997, Analogue modeling of pull-apart basins: American Association of Petroleum Geologists Bulletin, v. 81, no.11, p. 1804 -- 1826).

There are few resources available that help students visualize the dynamic nature of faulting, especially the complex interplay of faults during growth and evolution of a fault system. Such an understanding is critical, however, if students are to think meaningfully about fault geometries and what they imply.

Conducting scale-model experiments in a class setting is useful, but very time-consuming, difficult for all students to see well, and very temporary, except for the end product. Accordingly, taking a cue from a movie produced by Ken McClay, I constructed a deformation apparatus, conducted and filmed several experiments conducted by McClay, and then produced QuickTime movies of the experiments. This approach makes it possible for students to observe an experiment in a minute or two that took 30-45 minutes to produce and to view the experiment repeatedly, so as to become very familiar with all that is taking place.

Individual frames from the movie provide a template on which students can identify the sequence of fault development, rotation of features, and cessation of motion on some faults as they become inactive. Requiring students to document their observations, establish a chronological sequence of events, and explain in writing what happens during the experiment results in an increased awareness of the faulting process.

(Note: this resource was added to OER Commons as part of a batch upload of over 2,200 records. If you notice an issue with the quality of the metadata, please let us know by using the 'report' button and we will flag it for consideration.)

Subject:
Biology
Geoscience
Life Science
Physical Science
Material Type:
Activity/Lab
Diagram/Illustration
Provider:
Science Education Resource Center (SERC) at Carleton College
Provider Set:
Teach the Earth
Author:
Bob Burger
Date Added:
09/14/2020
Examining Topography and Stream Discharge at Sherburne National Wildlife Refuge
Conditional Remix & Share Permitted
CC BY-NC-SA
Rating
0.0 stars

In this inquiry based geologic field lab students will be estimating and measuring stream flow. Students will also map out a full scale live topography map of a dry streambed to help them estimate flow discharge. Students will use their journals to record their hypothesis, lab report questions, graphed data and evidence to backs up their observations.

Subject:
Geology
Geoscience
Physical Science
Material Type:
Activity/Lab
Assessment
Lesson Plan
Provider:
Science Education Resource Center (SERC) at Carleton College
Provider Set:
Pedagogy in Action
Author:
Todd Keonig
Date Added:
12/13/2011
Excerpt: The Voyage of the James Caird by Ernest Shackleton
Read the Fine Print
Rating
0.0 stars

This online article provides a firsthand report of Ernest Shackleton's epic 800-mile ocean crossing. In 1914, Shackleton planned to cross the continent of Antarctica from one sea to the other. One day's sail away from the continent, his specially constructed ship, the Endurance, was trapped in pack ice; 281 days later, crushed, the boat sank. The fifty-six-man crew survived as castaways on the ice for five months, after which Shackleton led them some 180 miles to the relative safety of Elephant Island. He and five men then embarked on an epic, 800-mile ocean crossing to South Georgia Island, the nearest inhabited area, in a twenty-two-foot lifeboat called the James Caird. This article is an account of that journey.

Subject:
Geoscience
History
History, Law, Politics
Physical Science
Material Type:
Data Set
Provider:
American Museum of Natural History
Provider Set:
American Museum of Natural History
Author:
Gary Pierson
Date Added:
10/15/2014
Exercise to Calculate River Discharge
Conditional Remix & Share Permitted
CC BY-NC-SA
Rating
0.0 stars

Spreadsheets Across the Curriculum module. Students use field data from rivers to understand how river discharge is calculated.

Subject:
Geoscience
Mathematics
Physical Science
Material Type:
Activity/Lab
Provider:
Science Education Resource Center (SERC) at Carleton College
Provider Set:
Pedagogy in Action
Author:
Nicholas Baer
Date Added:
11/06/2014
Expedition 8 Crew Talks to Students in Japan
Read the Fine Print
Educational Use
Rating
0.0 stars

In this video segment adapted from NASA, students in Matsuyama City, Japan, interview Expedition 8 Commander and NASA Science Officer Mike Foale and Flight Engineer Alexander Kaleri about life and work aboard the International Space Station.

Subject:
Applied Science
Astronomy
Chemistry
Education
Geoscience
Physical Science
Physics
Space Science
Technology
Material Type:
Activity/Lab
Diagram/Illustration
Provider:
PBS LearningMedia
Provider Set:
PBS Learning Media: Multimedia Resources for the Classroom and Professional Development
Author:
National Science Foundation
WGBH Educational Foundation
Date Added:
12/17/2005
Explaining Seismic Hazard Probabilities
Conditional Remix & Share Permitted
CC BY-NC-SA
Rating
0.0 stars

This activity asks students to explain earthquake hazard probabilities to a lay audience of citizens, government officials and others.

Subject:
Geoscience
Mathematics
Physical Science
Material Type:
Activity/Lab
Provider:
Science Education Resource Center (SERC) at Carleton College
Provider Set:
Pedagogy in Action
Author:
Mary Savina
Date Added:
11/06/2014
Explorando mapas de colores: Usando datos de ozono estratosférico
Read the Fine Print
Rating
0.0 stars

Using the 5E instructional model, students discover the value of using color maps to visualize data. The activity requires students to create a color map of the ozone hole from Dobson data values derived from the Aura satellite. Students then interpret that map and compare and evaluate different color scales. Note that this is the Spanish version of Exploring Color Maps: Using Stratospheric Ozone Data.

Subject:
Applied Science
Atmospheric Science
Engineering
Geoscience
Mathematics
Physical Science
Technology
Material Type:
Activity/Lab
Data Set
Diagram/Illustration
Provider:
NASA
Provider Set:
NASA Wavelength
Date Added:
11/05/2014
Exploring Annual Changes
Read the Fine Print
Rating
0.0 stars

In this activity, student teams conduct a quantitative exploration of the connections between parts of the Earth system, through examination of a time series of environmental data maps. By investigating the connections between environmental data, they see how Earth processes interact on varying time and spatial scales.This is one of six interrelated learning activities in the student activity guide associated with the GLOBE Earth System Poster, “Exploring Connections in Year 2007.” A series of assessment and extension activities are included.

Subject:
Applied Science
Engineering
Environmental Science
Geoscience
History
History, Law, Politics
Physical Science
Technology
Material Type:
Activity/Lab
Lesson Plan
Provider:
NASA
Provider Set:
NASA Wavelength
Date Added:
11/05/2014
Exploring Color Maps: Using Stratospheric Ozone Data
Read the Fine Print
Rating
0.0 stars

Through the use of the 5E instructional model, students discover the value of using color maps to visualize data. The activity requires students to create a color map of the ozone hole from Dobson data values derived from the Aura satellite. Students then interpret that map and compare and evaluate different color scales.

Subject:
Applied Science
Atmospheric Science
Engineering
Geoscience
Mathematics
Physical Science
Technology
Material Type:
Activity/Lab
Data Set
Diagram/Illustration
Provider:
NASA
Provider Set:
NASA Wavelength
Date Added:
11/05/2014