Updating search results...

Search Resources

1458 Results

View
Selected filters:
  • climate-change
D-Lab: Water, Climate Change, and Health
Conditional Remix & Share Permitted
CC BY-NC-SA
Rating
0.0 stars

D-Lab: Water, Climate Change, and Health is a project-based, experiential, and transdisciplinary course. Together with peers and experts, we will explore the vitally important interface of water, climate change, and health. This course addresses mitigation and adaptation to climate change as it pertains to water and health. Water-borne illness, malnutrition, and vector-borne diseases represent the top three causes of morbidity and mortality in regions of our focus. Students submit a term project, setting the stage for a lifelong commitment to communicating climate science to a broad public.

Subject:
Applied Science
Atmospheric Science
Health, Medicine and Nursing
Physical Science
Material Type:
Full Course
Provider:
MIT
Provider Set:
MIT OpenCourseWare
Author:
Murcott, Susan
Simpson, Juliet
Date Added:
02/01/2019
D-Lab: Water, Climate Change, and Health
Conditional Remix & Share Permitted
CC BY-NC-SA
Rating
0.0 stars

D-Lab: Water, Climate Change, and Health is a project-based, experiential, and transdisciplinary course. Together with peers and experts, we will explore the vitally important interface of water, climate change, and health. This course addresses mitigation and adaptation to climate change as it pertains to water and health. Water-borne illness, malnutrition, and vector-borne diseases represent the top three causes of morbidity and mortality in regions of our focus. Students submit a term project, setting the stage for a lifelong commitment to communicating climate science to a broad public.

Subject:
Applied Science
Atmospheric Science
Environmental Science
Health, Medicine and Nursing
Physical Science
Material Type:
Full Course
Provider:
MIT
Provider Set:
MIT OpenCourseWare
Author:
Murcott, Susan
Simpson, Juliet
Date Added:
02/01/2019
Daisyworld: Interactive On-line PC and Mac
Conditional Remix & Share Permitted
CC BY-NC-SA
Rating
0.0 stars

Students use a JAVA interface design by R.M. MacKay to explore the Daisy World model. The JAVA interface comes with a link to a 6-page student activity page in PDF format.

(Note: this resource was added to OER Commons as part of a batch upload of over 2,200 records. If you notice an issue with the quality of the metadata, please let us know by using the 'report' button and we will flag it for consideration.)

Subject:
Applied Science
Biology
Chemistry
Environmental Science
Life Science
Mathematics
Physical Science
Statistics and Probability
Material Type:
Activity/Lab
Provider:
Science Education Resource Center (SERC) at Carleton College
Provider Set:
Teach the Earth
Author:
Bob Mackay
Mike Clark
Date Added:
09/29/2022
Daisyworld: Stella Mac or PC
Conditional Remix & Share Permitted
CC BY-NC-SA
Rating
0.0 stars

After constructing a Stella model of Daisyworld students perform guided experiments to explore the behavior of Daisyworld to changes in model parameters and assumptions.

(Note: this resource was added to OER Commons as part of a batch upload of over 2,200 records. If you notice an issue with the quality of the metadata, please let us know by using the 'report' button and we will flag it for consideration.)

Subject:
Applied Science
Biology
Environmental Science
Life Science
Mathematics
Statistics and Probability
Material Type:
Activity/Lab
Provider:
Science Education Resource Center (SERC) at Carleton College
Provider Set:
Teach the Earth
Author:
Mike Clark
Date Added:
09/29/2022
Data Review and Action Plan (Art for the Earth #5)
Conditional Remix & Share Permitted
CC BY-NC
Rating
0.0 stars

SYNOPSIS: In this lesson, students analyze data, create line graphs, conduct research, and plan their data art project.

SCIENTIST NOTES: This lesson builds students' data analysis and research skills. Students learn how to use data to create an appealing artwork that can explain and raise awareness on climate change impacts. All materials are properly sourced, and datasets for analysis are accurate. The lesson has passed our science credibility process.

POSITIVES:
-Students learn how to create a line graph that includes title, x-axis label, y-axis label, data points, and a line connecting the data points.
-Students think critically in their groups and in whole class discussions.
-Students practice media literacy skills when conducting research.

ADDITIONAL PREREQUISITES:
-This is lesson 5 of 6 in our 3rd-5th grade Art for the Earth unit.
-Students should have a basic understanding of data analysis and why graphs are useful tools to view data.
-You may have to guide students to good resources when they are conducting research on their topic in the Investigate section. A great tip when students are doing online research is to use the PARC method, which stands for Purpose, Author, Reliability, and Currency. Students can ask of every website:
-What is the purpose of this website?
-Who is the author of this website?
-Is this website reliable?
-Is this website current?

DIFFERENTIATION:
-It may be best for students to collaborate when creating their line graphs. Grouping students with varying levels of logical-mathematical intelligence and spatial-visual intelligence would probably work best.
-Line graphs can also be created using technology tools, including iPads or Chromebooks.
-Your students may or may not have different line graphs. If the data comes from a true class campaign, all students will have the same line graph. If students gathered their own data for different issues or used the different available data from NASA, their line graphs will be different.
-The Inspire section is meant for students to prepare to complete their projects. They will actually finish their projects in the sixth lesson in this unit after discussing more about the impact of art on one's feelings, how colours affect emotions, and how to appeal to different audiences.

Subject:
Arts and Humanities
Geoscience
Mathematics
Physical Science
Space Science
Visual Arts
Material Type:
Lesson Plan
Provider:
SubjectToClimate
Author:
Lindsey Pockl
Monica Lilley
Date Added:
06/28/2023
Data Review and Action Plan (Art for the Earth #5)
Conditional Remix & Share Permitted
CC BY-NC
Rating
0.0 stars

In this lesson, students analyze data, create line graphs, conduct research, and plan their data art project.

Step 1 - Inquire: Students analyze their own data from the previous lesson.

Step 2 - Investigate: Students create a line graph and conduct research on their topic.

Step 3 - Inspire: Students plan their data art project.

Subject:
Applied Science
Arts and Humanities
Environmental Science
Material Type:
Lesson
Lesson Plan
Provider:
SubjectToClimate
Author:
Lindsey Pockl
Subject to Climate
Date Added:
04/06/2023
Data Set Not Found | National Snow and Ice Data Center
Read the Fine Print
Rating
0.0 stars

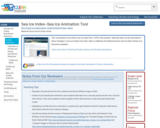
This visualization tool shows sea ice data from 1978 to the present. Selected data can be animated to show changes in sea ice extent over time. Data is added by the National Snow and Ice Data Center as it becomes available.

Subject:
Applied Science
Career and Technical Education
Environmental Science
Environmental Studies
Physical Science
Material Type:
Simulation
Provider:
CLEAN: Climate Literacy and Energy Awareness Network
Provider Set:
CLEAN: Climate Literacy and Energy Awareness Network
Author:
National Snow and Ice Data Center
Date Added:
08/17/2018
Dating Students: Relative vs. Numerical Time
Conditional Remix & Share Permitted
CC BY-NC-SA
Rating
0.0 stars

In this lab, students are introduced to the difference between relative and absolute dating, using the students themselves as the material to be ordered. Initially, the students are asked to develop physical clues to put themselves in order from youngest to oldest (exposing the inferences we make unconsciously about people's ages), and this will be refined/modified using a list of current events from an appropriate historical period that more and more of the students will remember, depending on their age (among other variables). Absolute age is introduced by having the students order themselves by birth decade, year, month, and day, and comparing the absolute age order to the order worked out in the relative-dating exercise, with a discussion of dating precision and accuracy.

(Note: this resource was added to OER Commons as part of a batch upload of over 2,200 records. If you notice an issue with the quality of the metadata, please let us know by using the 'report' button and we will flag it for consideration.)

Subject:
Applied Science
Biology
Environmental Science
Geology
Information Science
Life Science
Mathematics
Measurement and Data
Physical Science
Material Type:
Activity/Lab
Provider:
Science Education Resource Center (SERC) at Carleton College
Provider Set:
Teach the Earth
Author:
Susan Zimmerman
Date Added:
08/10/2019
Deadly Heat Waves Projected in the Densely-Populated Agricultural Regions of South Asia
Unrestricted Use
CC BY
Rating
0.0 stars

This resource is a video abstract of a research paper created by Research Square on behalf of its authors. It provides a synopsis that's easy to understand, and can be used to introduce the topics it covers to students, researchers, and the general public. The video's transcript is also provided in full, with a portion provided below for preview:

"The Earth is undeniably getting hotter. For the third time in a row, the past year has gone down as the hottest on record. While researchers don’t expect every year to be record-shattering, the trend is disconcerting—perhaps nowhere more so than in South Asia. A new study shows that here, unique climate effects converge with poor living conditions and high population density to create the most at-risk hot spot on our planet. Climate data shows that some of the world’s hottest zones lie across Asia. In these areas, the wet-bulb temperature, a measure of temperature that accounts for humidity, reaches life-threatening highs, commonly above 28°C. For perspective, consider that spending just a few hours at a wet-bulb temperature of 35°C is enough to cause death. And according to an international team of researchers, this heating trend might only get worse..."

The rest of the transcript, along with a link to the research itself, is available on the resource itself.

Subject:
Atmospheric Science
Physical Science
Material Type:
Diagram/Illustration
Reading
Provider:
Research Square
Provider Set:
Video Bytes
Date Added:
03/22/2021
Debating the Grid Example
Read the Fine Print
Educational Use
Rating
0.0 stars

Students research electricity, its sources, how energy grids function, how to make grids most efficient, and how to bring different types of energy generation together to diversify grids. Students debate the costs and benefits of moving to a modernized Smart Grid.

Subject:
Applied Science
Atmospheric Science
Career and Technical Education
Environmental Science
Environmental Studies
Physical Science
Material Type:
Activity/Lab
Lesson
Lesson Plan
Provider:
CLEAN: Climate Literacy and Energy Awareness Network
Provider Set:
CLEAN: Climate Literacy and Energy Awareness Network
Author:
Cheryl Manning
Climate Literacy and Energy Awareness Network (CLEAN)
Date Added:
04/20/2022
Debunking Cranky Uncle on past climate change
Read the Fine Print
Educational Use
Rating
0.0 stars

This humorous short video uses the 'single-cause fallacy' to debunk the myth that current changes in the Earth's climate are a result of natural phenomenon. The video is one of several in the 'Cranky Uncle' series.

Subject:
Applied Science
Career and Technical Education
Environmental Science
Environmental Studies
Physical Science
Material Type:
Diagram/Illustration
Reading
Provider:
CLEAN: Climate Literacy and Energy Awareness Network
Provider Set:
CLEAN: Climate Literacy and Energy Awareness Network
Author:
John Cook
Date Added:
07/05/2021
Debunking Cranky Uncle on the carbon cycle
Read the Fine Print
Educational Use
Rating
0.0 stars

This video illustrates the Keeling curve as evidence to establish man's role in global climate change.

Subject:
Applied Science
Atmospheric Science
Career and Technical Education
Environmental Science
Environmental Studies
Physical Science
Material Type:
Diagram/Illustration
Reading
Provider:
CLEAN: Climate Literacy and Energy Awareness Network
Provider Set:
CLEAN: Climate Literacy and Energy Awareness Network
Author:
John Cook
Date Added:
07/05/2021
Decoding Antarctica's Climate History - Antarctica's Climate Secrets
Read the Fine Print
Educational Use
Rating
0.0 stars

This 10 minute video builds connections between topics that are important in climate science such as: the impact of variations in Earth's orbit and wobble on it's axis on climate; how the cores being sampled fit into the bigger climate picture; connecting greenhouse gases to melting ice and sea level changes; the sensitivity of the ice melt / sea level rise relationship; and computer model simulations showing connections between ice sheets and sea level.
The companion website provides resources, an extensive list of activities, teacher guides, posters, and more.

Subject:
Applied Science
Archaeology
Career and Technical Education
Environmental Science
Environmental Studies
Oceanography
Physical Geography
Physical Science
Social Science
Material Type:
Diagram/Illustration
Reading
Provider:
CLEAN: Climate Literacy and Energy Awareness Network
Provider Set:
CLEAN: Climate Literacy and Energy Awareness Network
Author:
Nebraska Educational Telecommunications
Date Added:
06/25/2019
Deforestation Odes and Elegies
Conditional Remix & Share Permitted
CC BY-NC
Rating
0.0 stars

SYNOPSIS: In this lesson, students learn about deforestation and climate change and respond by writing an ode or an elegy.

SCIENTIST NOTES: This lesson empowers students to understand what deforestation entails and how they can write poems to express their feelings of grief, respect, emotion, and valor in combating deforestation in their community. All materials used in the lesson have been verified and are suitable for teaching. In this light, this lesson is credible and recommended for the classroom.

POSITIVES:
-This lesson can be used as a standalone or as a lesson in a poetry unit.
-Students are given voice and choice.
-Students create their own poetic response to a real-world challenge.

ADDITIONAL PREREQUISITES:
-Students should have some basic understanding of poetry.
-Students should have a basic understanding of deforestation and its connection to climate change.

DIFFERENTIATION:
-This lesson is easily adaptable to Advanced Placement or honors level classes by including other literary and language elements in the poems such as juxtaposition, oxymoron, consonance, assonance, enjambment, alliteration, and personification.
-Students can write each stanza in a different meter or rhyme. Examples include iambic pentameter or ABBA rhyme scheme.
-Teachers can split the lesson in two and focus on an ode in the first lesson and an elegy in the second.
-Students can write both an ode and an elegy and compare the differences in writing, tone, and overall effect.
-Social studies, civics, and economics classes can extend this topic to social justice, socioeconomic class, and cultural impacts of deforestation within each specific region.
-Student poems can be shared outside of the classroom in the school newspaper or a community newsletter, on a class or teacher website, on school display boards, or in extracurricular poetry or environmental clubs.

Subject:
English Language Arts
Material Type:
Lesson Plan
Provider:
SubjectToClimate
Author:
Yen-Yen Chiu
Date Added:
06/30/2023
Deforestation and Climate Change (Water Cycle, Deforestation, and Climate Change #3)
Conditional Remix & Share Permitted
CC BY-NC
Rating
0.0 stars

SYNOPSIS: In this lesson, students learn how climate change and deforestation are linked to the water cycle.

SCIENTIST NOTES: This lesson provides students with a background on the relationship between deforestation, water cycle, erosion, and climate change. It establishes the fact that deforestation poses stress on the forest ecosystem and services, including impacting the water cycle and speeding up erosion and climate change. These issues could be addressed with well-informed adaptive strategies and action to restore the forest and biodiversity. All materials have been verified thoroughly, and this lesson has passed the science credibility process.

POSITIVES:
-Students participate in multiple interactive and hands-on learning activities to engage in kinesthetic, auditory, and visual learning.
-Students continue to better their understanding of how Earth’s natural systems are interconnected and dependent on each other.

ADDITIONAL PREREQUISITES:
-This is lesson 3 of 4 in our 6th-8th grade Water Cycle, Deforestation, and Climate Change unit.
-Materials required for the erosion model activity include the following:
-Scissors or sharp knife
-Clean, empty one-gallon container with a lid (such as a plastic milk jug)
-Water
-Two aluminum bread pans
-Dirt
-Two aluminum, 9-by-13-inch cake pans
-12 to 14 plastic forks
-Two blocks, shallow plastic containers, or other items of the same height to prop up the aluminum bread pans
-Outdoor test area with a flat, level surface where it is easy to clean spilled water and soil

DIFFERENTIATION:
-The erosion activity may be completed as a hands-on activity in lab groups or as a demonstration by the teacher.
-Lab groups may be in mixed abilities to aid in understanding.
-Teachers can prepare examples of diagrams for students to reference during the Inspire section.

Subject:
Geoscience
Physical Science
Space Science
Material Type:
Lesson Plan
Provider:
SubjectToClimate
Author:
Mallory Swafford
Date Added:
06/29/2023
Deforestation and Climate Change (Water Cycle, Deforestation, and Climate Change #3)
Conditional Remix & Share Permitted
CC BY-NC
Rating
0.0 stars

In this lesson, students learn how climate change and deforestation are linked to the water cycle.

Step 1 - Inquire: Students view an Indigenous perspective on deforestation and learn how climate change can lead to deforested areas.

Step 2 - Investigate: Students complete a hands-on activity to investigate the effects of deforestation on erosion and watch a video on deforestation and climate change.

Step 3 - Inspire: Students create a cause and effect diagram about erosion and the water cycle.

Subject:
Applied Science
Environmental Science
Material Type:
Lesson
Lesson Plan
Provider:
SubjectToClimate
Author:
Mallory Swafford
Date Added:
03/15/2023
Deforestation and Habitat Destruction (Art for the Earth #2)
Conditional Remix & Share Permitted
CC BY-NC
Rating
0.0 stars

SYNOPSIS: In this lesson, students learn about deforestation, analyze paintings featuring deforestation themes, and then have the choice to learn about Wangari Maathai or design a climate action plan related to deforestation.

SCIENTIST NOTES: The lesson allows students to explore the importance of reforestation to combat climate change. There are no scientific misconceptions in the lesson except for one instance in the Young Voices for the Planet video, which is embedded on slide 19 of the Teacher Slideshow. At 3 minutes, 35 seconds into the video, the boy Julian says, "We plant trees to help climate change." This is an error because we plant trees to fight climate change. All other materials are properly sourced. Thus, this lesson has passed our science credibility process.

POSITIVES:
-There is opportunity for a lot of peer and group discussion in this lesson.
-Students share their own thoughts and feelings about Jill Pelto's art, validating how they feel about deforestation and climate change.

ADDITIONAL PREREQUISITES:
-This is lesson 2 of 6 in our 3rd-5th grade Art for the Earth unit.
-A stable Internet connection is required to play the videos, especially the Google Earth timelapse video.
-Students should have some background knowledge on Jill Pelto, which you can find in lesson 1 of our Art for the Earth unit.

DIFFERENTIATION:
-This entire lesson lends itself to discussion. Group students accordingly so they can get the most out of this lesson.
-The Google Earth timelapse video of deforestation can be emotional to watch. Students may react with anger, sadness, fear, or shock. Tell them that those feelings are normal and natural. You can also tell them that you are learning about deforestation and climate change in order to do something about it. Empowering your students is one of the most powerful gifts you can give them.
-Some students may be eager to share their thoughts and feelings about Jill Pelto's art. Let them share with the class. Some students, however, may want to keep their feelings to themselves. That is OK too.
-The Inspire section of this lesson features a lot of student agency. Some students may want to learn more about Wangari Maathai and then be "done" with the deforestation part of this unit. Other students may want to design an action plan for your school or community. Perhaps they'd like to plant more trees on your school grounds. Support these students appropriately, and perhaps their efforts will lead to a greener, healthier, calmer school environment.

Subject:
Arts and Humanities
Geoscience
Physical Science
Space Science
Visual Arts
Material Type:
Lesson Plan
Provider:
SubjectToClimate
Author:
Lindsey Pockl
Monica Lilley
Date Added:
06/30/2023
Deforestation in the Amazon
Unrestricted Use
CC BY
Rating
0.0 stars

This NASA animation on land cover change zooms into Rondonia, Brazil. It starts with a Landsat satellite image taken in 1975 and dissolves into a second image of the same region taken in 2009 that illustrates a significant amount of land use change.

Subject:
Applied Science
Environmental Science
Provider:
CLEAN: Climate Literacy and Energy Awareness Network
Provider Set:
CLEAN: Climate Literacy and Energy Awareness Network
Author:
NASA Visualization Studio
Date Added:
06/19/2012
Desalination Exploration
Conditional Remix & Share Permitted
CC BY-NC
Rating
0.0 stars

SYNOPSIS: In this lesson, students explore different methods of desalination.

SCIENTIST NOTES: This lesson teaches students about potable water scarcity and then explores desalination as a possible solution in water-stressed areas. Desalination technologies are introduced, and energy and environmental costs of desalination are discussed. A video resource explores a novel desalination technology, the Solar Dome, being built in Saudi Arabia. Students are tasked with designing and building their own solar still, and opportunity is given for design optimization. This lesson is recommended for teaching.

POSITIVES:
-This lesson can be multidisciplinary and can be completed in engineering, computer science, digital art, English or science classes.
-Students and teachers are given voice and multiple areas of choice in this lesson.
-Students become agents of change in their own communities, identifying problems and solutions.
-Students and teachers can make this conceptual, practical, or hands-on.
-This lesson can be spread out over several days and be considered a mini-unit.

ADDITIONAL PREREQUISITES:
-Students should be familiar with the basics of climate change.
-Students should be familiar with the basic scientific concepts of osmosis.
-Students should be familiar with basic engineering concepts like scaling and design.

DIFFERENTIATION:
-Students can work independently or in a group with adjusted requirements.
-Teachers can use subject and grade level vocabulary already being worked on or learned in class. Teachers can add vocabulary words in the glossary slide of the Teacher Slideshow.
-To further develop practical science or engineering skills, students can work together to create and implement a workable desalination solution at the school, home, or community level. Students can lead a workshop for family, an environmental club, or the community.
-Some students may wish to communicate their advocacy via social media. Make sure to follow all school rules and monitor students’ progress if you allow this in the classroom.

Subject:
Applied Science
Computer Science
Material Type:
Lesson Plan
Provider:
SubjectToClimate
Author:
Yen-Yen Chiu
Date Added:
06/30/2023
Designing a Climate-Neutral World: An Introduction
Conditional Remix & Share Permitted
CC BY-NC-SA
Rating
0.0 stars

Mitigation of climate change is one of the most important challenges of our times. To prevent irreversible damage to human societies and the environment, it was agreed that world countries should limit the global average temperature rise. To avoid the dangerous impacts of climate change, it is needed to limit global temperature rise to well below 2 °C or even to 1.5 °C above pre-industrial levels.

This requires cutting global greenhouse gas emissions to near-zero levels in the coming decades. Especially for the energy system, a drastic transformation is needed.

We know that such a transformation is possible, but it will require virtually every organization, whether it is a steel company, a hospital or a municipality, to tackle climate change challenges. The question that often arises is – where to start?

This course is designed for the professionals that might be the leaders of this transformation in their organization - policymakers, sustainability consultants or professionals from other fields -who want to familiarize themselves with climate change mitigation strategies so theycan apply it to their projects.

In the first part of the course, you will obtain basic knowledge including greenhouse gas (GHG) emissions, the various types of GHG (CO2 and non-CO2), their emissions and about the Paris Agreement. You will also learn about current energy systems, electricity generation and the energy demand of various sectors.

Next, we will focus on courses of action and methods that will assist in selecting the best options in any type of project or organization. We will present methodologies for measurement of emissions reduction and calculation of costs. Here we will introduce you to the concepts of “marginal abatement cost curves” which will help you analyze alternatives by comparing emission reduction potential with the costs involved. Finally, various options such as renewable energy, energy efficiency and electrification will be discussed as the emission reduction strategies.

We invite you to join this journey and to bring your own experiences and challenges to your organization.
Subject:
Applied Science
Engineering
Material Type:
Full Course
Provider:
Delft University of Technology
Author:
Kornelis Blok
Date Added:
03/09/2023