Updating search results...

Search Resources

521 Results

View
Selected filters:
  • measurements-and-data
Making Sense of Density
Only Sharing Permitted
CC BY-NC-ND
Rating
0.0 stars

Kent Treadgold's 7th grade science class uses a hands-on project to learn the abstract concept of density. They measure the mass and volume of different cylinders, create their own computerized spreadsheets for data, and enter the formula to calculate density. By the end of the project, they're able to conclude on their own that density will not change as the shape and size of an object changes, as long as the material it's made of stays the same.

Subject:
Education
Physical Science
Physics
Material Type:
Lesson Plan
Teaching/Learning Strategy
Provider:
Teaching Channel
Provider Set:
Teaching Channel
Author:
Kent Treadgold
Date Added:
11/02/2012
Making a Sundial
Unrestricted Use
CC BY
Rating
0.0 stars

In this activity, students discuss the notion of time and how time can be measured. They learn that a long time ago, people used different tools to measure time. Students build and use a sundial and discover that a long time ago, it was much more difficult to accurately tell the time than it is today.

Subject:
Applied Science
Physical Science
Material Type:
Activity/Lab
Provider:
International Astronomical Union
Provider Set:
astroEDU
Date Added:
01/01/2016
Masses & Springs
Unrestricted Use
CC BY
Rating
0.0 stars

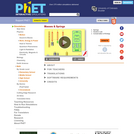
A realistic mass and spring laboratory. Hang masses from springs and adjust the spring stiffness and damping. You can even slow time. Transport the lab to different planets. A chart shows the kinetic, potential, and thermal energy for each spring.

Subject:
Physical Science
Physics
Material Type:
Simulation
Provider:
University of Colorado Boulder
Provider Set:
PhET Interactive Simulations
Author:
Kathy Perkins
Michael Dubson
The Mortenson Family Foundation
Wendy Adams
Date Added:
04/26/2006
Masses & Springs (AR)
Unrestricted Use
CC BY
Rating
0.0 stars

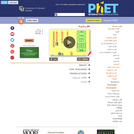
A realistic mass and spring laboratory. Hang masses from springs and adjust the spring stiffness and damping. You can even slow time. Transport the lab to different planets. A chart shows the kinetic, potential, and thermal energy for each spring.

Subject:
Physical Science
Physics
Material Type:
Simulation
Provider:
University of Colorado Boulder
Provider Set:
PhET Interactive Simulations
Author:
Kathy Perkins
Michael Dubson
Wendy Adams
Date Added:
08/02/2009
Math, Grade 6, Distributions and Variability
Conditional Remix & Share Permitted
CC BY-NC
Rating
0.0 stars

Distributions and Variability

Type of Unit: Project

Prior Knowledge

Students should be able to:

Represent and interpret data using a line plot.
Understand other visual representations of data.

Lesson Flow

Students begin the unit by discussing what constitutes a statistical question. In order to answer statistical questions, data must be gathered in a consistent and accurate manner and then analyzed using appropriate tools.

Students learn different tools for analyzing data, including:

Measures of center: mean (average), median, mode
Measures of spread: mean absolute deviation, lower and upper extremes, lower and upper quartile, interquartile range
Visual representations: line plot, box plot, histogram

These tools are compared and contrasted to better understand the benefits and limitations of each. Analyzing different data sets using these tools will develop an understanding for which ones are the most appropriate to interpret the given data.

To demonstrate their understanding of the concepts, students will work on a project for the duration of the unit. The project will involve identifying an appropriate statistical question, collecting data, analyzing data, and presenting the results. It will serve as the final assessment.

Subject:
Mathematics
Statistics and Probability
Material Type:
Unit of Study
Provider:
Pearson
Math, Grade 6, Distributions and Variability, Collecting & Organizing Data
Conditional Remix & Share Permitted
CC BY-NC
Rating
0.0 stars

Students collect data to answer questions about a typical sixth grade student. Students collect data about themselves, working in pairs to measure height, arm span, etc. Students discuss characteristics they would like to know about sixth grade students, adding these topics to a preset list. Data are collected and organized such that there is a class data set for each topic for future use. Students are asked to think about how this data could be represented and organized.Key ConceptsFor data to be useful, it must be collected in a consistent and accurate way. For example, for height data, students must agree on whether students should be measured with shoes on or off, and whether heights should be measured to the nearest inch, half inch, or centimeter.Goals and Learning ObjectivesGather data about sixth grade students.Consider how data are collected.

Subject:
Statistics and Probability
Material Type:
Lesson Plan
Date Added:
09/21/2015
Math, Grade 6, Surface Area and Volume
Conditional Remix & Share Permitted
CC BY-NC
Rating
0.0 stars

Surface Area and Volume

Type of Unit: Conceptual

Prior Knowledge

Students should be able to:

Identify rectangles, parallelograms, trapezoids, and triangles and their bases and heights.
Identify cubes, rectangular prisms, and pyramids and their faces, edges, and vertices.
Understand that area of a 2-D figure is a measure of the figure's surface and that it is measured in square units.
Understand volume of a 3-D figure is a measure of the space the figure occupies and is measured in cubic units.

Lesson Flow

The unit begins with an exploratory lesson about the volumes of containers. Then in Lessons 2–5, students investigate areas of 2-D figures. To find the area of a parallelogram, students consider how it can be rearranged to form a rectangle. To find the area of a trapezoid, students think about how two copies of the trapezoid can be put together to form a parallelogram. To find the area of a triangle, students consider how two copies of the triangle can be put together to form a parallelogram. By sketching and analyzing several parallelograms, trapezoids, and triangles, students develop area formulas for these figures. Students then find areas of composite figures by decomposing them into familiar figures. In the last lesson on area, students estimate the area of an irregular figure by overlaying it with a grid. In Lesson 6, the focus shifts to 3-D figures. Students build rectangular prisms from unit cubes and develop a formula for finding the volume of any rectangular prism. In Lesson 7, students analyze and create nets for prisms. In Lesson 8, students compare a cube to a square pyramid with the same base and height as the cube. They consider the number of faces, edges, and vertices, as well as the surface area and volume. In Lesson 9, students use their knowledge of volume, area, and linear measurements to solve a packing problem.

Subject:
Geometry
Mathematics
Material Type:
Unit of Study
Provider:
Pearson
Math, Grade 6, Surface Area and Volume, Analyzing The Formula of A Parallelogram & Trapezoid
Conditional Remix & Share Permitted
CC BY-NC
Rating
0.0 stars

Lesson OverviewStudents find the area of a parallelogram by rearranging it to form a rectangle. They find the area of a trapezoid by putting together two copies of it to form a parallelogram. By doing these activities and by analyzing the dimensions and areas of several examples of each figure, students develop and understand area formulas for parallelograms and trapezoids.Key ConceptsA parallelogram is a quadrilateral with two pairs of parallel sides. The base of a parallelogram can be any of the four sides. The height is the perpendicular distance from the base to the opposite side.A trapezoid is a quadrilateral with exactly one pair of parallel sides. The bases of a trapezoid are the parallel sides. The height is the perpendicular distance between the bases.You can cut a parallelogram into two pieces and reassemble them to form a rectangle. Because the area does not change, the area of the rectangle is the same as the area of the parallelogram. This gives the parallelogram area formula A = bh.You can put two identical trapezoids together to form a parallelogram with the same height as the trapezoid and a base length equal to the sum of the base lengths of the trapezoid. The area of the parallelogram is (b1 + b2)h, so the area of the trapezoid is one-half of this area. Thus, the trapezoid area formula is A = 12(b1 + b2)h.Goals and Learning ObjectivesDevelop and explore the formula for the area of a parallelogram.Develop and explore the formula for the area of a trapezoid.

Subject:
Geometry
Material Type:
Lesson Plan
Date Added:
09/21/2015
Math, Grade 6, Surface Area and Volume, Analyzing The Formula of A Triangle
Conditional Remix & Share Permitted
CC BY-NC
Rating
0.0 stars

Lesson OverviewStudents find the area of a triangle by putting together a triangle and a copy of the triangle to form a parallelogram with the same base and height as the triangle. Students also create several examples of triangles and look for relationships among the base, height, and area measures. These activities lead students to develop and understand a formula for the area of a triangle.Key ConceptsTo find the area of a triangle, you must know the length of a base and the corresponding height. The base of a triangle can be any of the three sides. The height is the perpendicular distance from the vertex opposite the base to the line containing the base. The height can be found inside or outside the triangle, or it can be the length of one of the sides.You can put together a triangle and a copy of the triangle to form a parallelogram with the same base and height as the triangle. The area of the original triangle is half of the area of the parallelogram. Because the area formula for a parallelogram is A = bh, the area formula for a triangle is A = 12bh.Goals and Learning ObjectivesDevelop and explore the formula for the area of a triangle.

Subject:
Geometry
Material Type:
Lesson Plan
Date Added:
09/21/2015
Math, Grade 7
Conditional Remix & Share Permitted
CC BY-NC
Rating
0.0 stars

Four full-year digital course, built from the ground up and fully-aligned to the Common Core State Standards, for 7th grade Mathematics. Created using research-based approaches to teaching and learning, the Open Access Common Core Course for Mathematics is designed with student-centered learning in mind, including activities for students to develop valuable 21st century skills and academic mindset.

Subject:
Mathematics
Material Type:
Full Course
Provider:
Pearson
Date Added:
10/06/2016
Math, Grade 7, Algebraic Reasoning
Conditional Remix & Share Permitted
CC BY-NC
Rating
0.0 stars

Algebraic Reasoning

Type of Unit: Concept

Prior Knowledge

Students should be able to:

Add, subtract, multiply, and divide rational numbers.
Evaluate expressions for a value of a variable.
Use the distributive property to generate equivalent expressions including combining like terms.
Understand solving an equation or inequality as a process of answering a question: which values from a specified set, if any, make the equation or inequality true?
Write and solve equations of the form x+p=q and px=q for cases in which p, q, and x are non-negative rational numbers.
Understand and graph solutions to inequalities x<c or x>c.
Use equations, tables, and graphs to represent the relationship between two variables.
Relate fractions, decimals, and percents.
Solve percent problems included those involving percent of increase or percent of decrease.

Lesson Flow

This unit covers all of the Common Core State Standards for Expressions and Equations in Grade 7. Students extend what they learned in Grade 6 about evaluating expressions and using properties to write equivalent expressions. They write, evaluate, and simplify expressions that now contain both positive and negative rational numbers. They write algebraic expressions for problem situations and discuss how different equivalent expressions can be used to represent different ways of solving the same problem. They make connections between various forms of rational numbers. Students apply what they learned in Grade 6 about solving equations such as x+2=6 or 3x=12 to solving equations such as 3x+6=12 and 3(x−2)=12. Students solve these equations using formal algebraic methods. The numbers in these equations can now be rational numbers. They use estimation and mental math to estimate solutions. They learn how solving linear inequalities differs from solving linear equations and then they solve and graph linear inequalities such as −3x+4<12. Students use inequalities to solve real-world problems, solving the problem first by arithmetic and then by writing and solving an inequality. They see that the solution of the algebraic inequality may differ from the solution to the problem.

Subject:
Algebra
Mathematics
Material Type:
Unit of Study
Provider:
Pearson
Math, Grade 7, Algebraic Reasoning, Algebraic Expressions & Equations
Conditional Remix & Share Permitted
CC BY-NC
Rating
0.0 stars

Students use algebraic expressions and equations to represent rules of thumb involving measurement. They use properties of operations and the relationships between fractions, decimals, and percents to write equivalent expressions.Key ConceptsExpressions and equations are different. An expression is a number, a variable, or a combination of numbers and variables. Some examples of expressions are:74x5a + b3(2m + 1)In Grade 7, the focus is on linear expressions. A linear expression is a sum of terms that are either rational numbers or a rational number times a variable (with an exponent of either 0 or 1). If an expression contains a variable, it is called an algebraic expression. To evaluate an expression, each variable is replaced with a given value.Equivalent expressions are expressions for which a given value can be substituted for each variable and the value of the expressions are the same.An equation is a statement that two expressions are equal. An equation can be true or false. To solve an equation, students find the value of the variable that makes the equation true.Students solve an equation that involves finding 10% of a number. They see that finding 10% of the number is the same as finding 0.1 of the number, or finding 110 of the number.Goals and Learning ObjectivesWrite expressions and equations to represent real-world situations.Evaluate expressions for given values of a variable.Use properties of operations to write equivalent expressions.Solve one-step equations.Check the solution to an equation.

Subject:
Algebra
Material Type:
Lesson Plan
Date Added:
09/21/2015
Math, Grade 7, Constructions and Angles
Conditional Remix & Share Permitted
CC BY-NC
Rating
0.0 stars

Constructions and Angles

Unit Overview

Type of Unit: Concept

Prior Knowledge

Students should be able to:

Use a protractor and ruler.
Identify different types of triangles and quadrilaterals and their characteristics.

Lesson Flow

After an initial exploratory lesson involving a paper folding activity that gets students thinking in general about angles and figures in a context, the unit is divided into two concept development sections. The first section focuses on types of angles—adjacent, supplementary, complementary, and vertical—and how they are manifested in quadrilaterals. The second section looks at triangles and their properties, including the angle sum, and how this affects other figures.

In the first set of conceptual lessons, students explore different types of angles and where the types of angles appear in quadrilaterals. Students fold paper and observe the angles formed, draw given angles, and explore interactive sketches that test many cases. Students use a protractor and ruler to draw parallelograms with given properties. They explore sketches of parallelograms with specific properties, such as perpendicular diagonals. After concluding the investigation of the angle types, students move on to the next set.

In the second set of conceptual development lessons, students focus on triangles. Students again fold paper to create figures and certain angles, such as complementary angles.

Students draw, using a protractor and ruler, other triangles with given properties. Students then explore triangles with certain known and unknown elements, such as the number of given sides and angles. This process starts with paper folding and drawing and continues with exploration of interactive sketches. Students draw conclusions about which cases allow 0, 1, 2, or an infinite number of triangles. In the course of the exploration, students discover that the sum of the measure of the interior angles of a triangle is 180°. They also learn that the sum of the measures of the interior angles of a quadrilateral is 360°. They explore other polygons to find their angle sum and determine if there is a relationship to angle sum of triangles. The exploration concludes with finding the measure of the interior angles of regular polygons and speculating about how this relates to a circle.

Lastly, students solve equations to find unknown angle measures. Using their previous experience, students find the remaining angle measures in a parallelogram when only one angle measure is given. Students also play a game similar to 20 Questions to identify types of triangles and quadrilaterals. Having completed the remaining lessons, students have a four-day Gallery to explore a variety of problems.

The unit ends with a unit assessment.
Subject:
Geometry
Mathematics
Material Type:
Unit of Study
Provider:
Pearson
Math, Grade 7, Constructions and Angles, Characteristics Of Parallelograms
Conditional Remix & Share Permitted
CC BY-NC
Rating
0.0 stars

Students learn more about the characteristics of parallelograms by folding paper and measuring the angles in a parallelogram. Students use a ruler and protractor to draw parallelograms with given properties. Then, students use a ruler and protractor to draw a rectangle.Key ConceptsOpposite angles of a parallelogram are congruent.Consecutive angles of a parallelogram are supplementary.Diagonals of a parallelogram bisect each other.Diagonals of a rectangle are congruent.Goals and Learning ObjectivesAccess prior knowledge of parallelograms.Understand that the sum of angle measures in any quadrilateral is 360°.Understand the relationship of the angles and diagonals in a parallelogram.Understand the relationship of the angles and diagonals in a rectangle.

Subject:
Geometry
Material Type:
Lesson Plan
Date Added:
09/21/2015
Math, Grade 7, Constructions and Angles, Four Types Of Angles
Conditional Remix & Share Permitted
CC BY-NC
Rating
0.0 stars

Students learn about four types of angles: adjacent, vertical, supplementary, and complementary. They explore the relationships between these types of angles by folding paper, measuring angles with a protractor, and exploring interactive sketches.Key ConceptsAdjacent angles are two angles that share a common vertex and a common side, but do not overlap. Angles 1 and 2 are adjacent angles.Supplementary angles are two angles whose measures have a sum of 180°. Angles 3 and 4 are supplementary angles. Complementary angles are two angles whose measures have a sum of 90°. Angles 5 and 6 are complementary angles. Vertical angles are the opposite angles formed by the intersection of two lines. Vertical angles are congruent. Angles 1 and 2 are vertical angles. Angles 3 and 4 are also vertical angles.Goals and Learning ObjectivesMeasure angles with a protractor and estimate angle measures as greater than or less than 90°.Understand the definition of vertical, adjacent, supplementary, and complementary angles.Explore the relationships between these types of angles.

Subject:
Geometry
Material Type:
Lesson Plan
Date Added:
09/21/2015
Math, Grade 7, Constructions and Angles, Pre-Assessment
Conditional Remix & Share Permitted
CC BY-NC
Rating
0.0 stars

Students solve for missing angle measures by applying what they have learned about types of angles and the angle measures of polygons. Students do a pre-assessment at the end of the lesson.Key ConceptsThere are many defining characteristics for angles, triangles, quadrilaterals, and polygons. Students have discovered these properties throughout this unit and have investigated why they are true. These characteristics and properties will be looked at more formally in high school geometry.Goals and Learning ObjectivesSolve for missing angle measures in polygons.

Subject:
Geometry
Material Type:
Lesson Plan
Date Added:
09/21/2015
Math, Grade 7, Proportional Relationships
Conditional Remix & Share Permitted
CC BY-NC
Rating
0.0 stars

Proportional Relationships

Type of Unit: Concept

Prior Knowledge

Students should be able to:

Understand what a rate and ratio are.
Make a ratio table.
Make a graph using values from a ratio table.

Lesson Flow

Students start the unit by predicting what will happen in certain situations. They intuitively discover they can predict the situations that are proportional and might have a hard time predicting the ones that are not. In Lessons 2–4, students use the same three situations to explore proportional relationships. Two of the relationships are proportional and one is not. They look at these situations in tables, equations, and graphs. After Lesson 4, students realize a proportional relationship is represented on a graph as a straight line that passes through the origin. In Lesson 5, they look at straight lines that do not represent a proportional relationship. Lesson 6 focuses on the idea of how a proportion that they solved in sixth grade relates to a proportional relationship. They follow that by looking at rates expressed as fractions, finding the unit rate (the constant of proportionality), and then using the constant of proportionality to solve a problem. In Lesson 8, students fine-tune their definition of proportional relationship by looking at situations and determining if they represent proportional relationships and justifying their reasoning. They then apply what they have learned to a situation about flags and stars and extend that thinking to comparing two prices—examining the equations and the graphs. The Putting It Together lesson has them solve two problems and then critique other student work.

Gallery 1 provides students with additional proportional relationship problems.

The second part of the unit works with percents. First, percents are tied to proportional relationships, and then students examine percent situations as formulas, graphs, and tables. They then move to a new context—salary increase—and see the similarities with sales taxes. Next, students explore percent decrease, and then they analyze inaccurate statements involving percents, explaining why the statements are incorrect. Students end this sequence of lessons with a formative assessment that focuses on percent increase and percent decrease and ties it to decimals.

Students have ample opportunities to check, deepen, and apply their understanding of proportional relationships, including percents, with the selection of problems in Gallery 2.

Subject:
Mathematics
Ratios and Proportions
Material Type:
Unit of Study
Provider:
Pearson
Math, Grade 7, Proportional Relationships, Exploring Numerical Relationships
Conditional Remix & Share Permitted
CC BY-NC
Rating
0.0 stars

Students are asked whether they can determine the number of books in a stack by measuring the height of the stack, or the number of marbles in a collection of marbles by weighing the collection.Students are asked to identify for which situations they can determine the number of books in a stack of books by measuring the height of the stack or the number of marbles in a collection of marbles by weighing the collection.Key ConceptsAs students examine different numerical relationships, they come to understand that they can find the number of books or the number of marbles in situations in which the books are all the same thickness and the marbles are all the same weight. This “constant” is equal to the value BA for a ratio A : B; students begin to develop an intuitive understanding of proportional relationships.Goals and Learning ObjectivesExplore numerical relationshipsSWD: Some students with disabilities will benefit from a preview of the goals in each lesson. Have students highlight the critical features or concepts to help them pay close attention to salient information.

Subject:
Numbers and Operations
Material Type:
Lesson Plan
Date Added:
09/21/2015