Updating search results...

Search Resources

1474 Results

View
Selected filters:
  • Geoscience
Cross Section and Slope
Read the Fine Print
Some Rights Reserved
Rating
0.0 stars

In this example, students learn how to read a topographic map and understand map contours. This resource is from PUMAS - Practical Uses of Math and Science - a collection of brief examples created by scientists and engineers showing how math and science topics taught in K-12 classes have real world applications.

Subject:
Geoscience
Mathematics
Physical Science
Material Type:
Lecture
Provider:
NASA
Provider Set:
NASA Wavelength
Date Added:
11/05/2014
Crystal Structures as Geobarometers
Conditional Remix & Share Permitted
CC BY-NC-SA
Rating
0.0 stars

This exercise is based on the recent formulation of a geobarometer based on the crystal structure of clinopyroxene (Nimis, 1995; 1998; 1999). This method relates structural parameters (e.g., the volumes of the unit cell and the M1 polyhedron) to the pressure at which the mineral crystallizes within basic and ultrabasic magmas.

In this exercise, students are guided into the American Mineralogist Crystal Structure Database to retrieve and download published crystal structure data for viewing in either the CrystalMaker or XtalDraw visualization software packages. The students are instructed on how to examine the structures to determine pressure-sensitive crystallographic parameters and are asked a series of questions related to what they learn.

(Note: this resource was added to OER Commons as part of a batch upload of over 2,200 records. If you notice an issue with the quality of the metadata, please let us know by using the 'report' button and we will flag it for consideration.)

Subject:
Chemistry
Geoscience
Mathematics
Measurement and Data
Physical Science
Statistics and Probability
Material Type:
Activity/Lab
Data Set
Diagram/Illustration
Interactive
Lesson Plan
Provider:
Science Education Resource Center (SERC) at Carleton College
Provider Set:
Teach the Earth
Author:
Kent Ratajeski
Date Added:
08/08/2019
Crystallization- Differentiation of Basaltic Magma
Conditional Remix & Share Permitted
CC BY-NC-SA
Rating
0.0 stars

In this exercise, students use major-element compositions of whole-rocks, volcanic glasses, and minerals in lavas and drill cores from the solidified Kilauea Iki lava lake. The data is presented in the form of a "precompiled" spreadsheet which contains selected analyses culled from the GEOROC database and a USGS Open File report. Students make graphs from the data to learn about the petrologic processes related to the eruption and in situ crystallization of basaltic magma

(Note: this resource was added to OER Commons as part of a batch upload of over 2,200 records. If you notice an issue with the quality of the metadata, please let us know by using the 'report' button and we will flag it for consideration.)

Subject:
Biology
Chemistry
Geoscience
Life Science
Mathematics
Measurement and Data
Physical Science
Statistics and Probability
Material Type:
Activity/Lab
Data Set
Interactive
Lesson Plan
Provider:
Science Education Resource Center (SERC) at Carleton College
Provider Set:
Teach the Earth
Author:
Kent Ratajeski
Date Added:
08/07/2019
Current Events Presentation Activity for Introductory Geoscience Classes
Conditional Remix & Share Permitted
CC BY-NC-SA
Rating
0.0 stars

For this two-part assignment, students first locate two substantial current events articles on geology-related topics from mainstream newspaper or magazine. The instructor assesses the articles, making sure that basic criteria have been met, and assigns one article for the student to share with the class in an informal 3-5 minute presentation.

(Note: this resource was added to OER Commons as part of a batch upload of over 2,200 records. If you notice an issue with the quality of the metadata, please let us know by using the 'report' button and we will flag it for consideration.)

Subject:
Biology
Geoscience
Life Science
Physical Science
Material Type:
Activity/Lab
Provider:
Science Education Resource Center (SERC) at Carleton College
Provider Set:
Teach the Earth
Author:
Eleanor Camann
Date Added:
08/07/2019
Curriculum Compacting
Conditional Remix & Share Permitted
CC BY-SA
Rating
0.0 stars

This article describes how curriculum compacting can be used to meet the needs of gifted students within the regular classroom.

Subject:
Applied Science
Environmental Science
Geoscience
Physical Science
Space Science
Material Type:
Teaching/Learning Strategy
Provider:
Ohio State University College of Education and Human Ecology
Provider Set:
Beyond Penguins and Polar Bears: An Online Magazine for K-5 Teachers
Author:
Tamara Fisher
Date Added:
10/17/2014
The Dance of Life
Conditional Remix & Share Permitted
CC BY-SA
Rating
0.0 stars

This nonfiction article, written for students in grades 4-5, explores the life and seasonal migration of the sanderling bird. Modified versions are available for students in younger grades.

Subject:
Applied Science
Environmental Science
Geoscience
Physical Science
Material Type:
Lesson Plan
Provider:
Ohio State University College of Education and Human Ecology
Provider Set:
Beyond Penguins and Polar Bears: An Online Magazine for K-5 Teachers
Author:
Stephen Whitt
Date Added:
10/17/2014
The Dance of Life: Grades 4-5: text only version
Conditional Remix & Share Permitted
CC BY-SA
Rating
0.0 stars

This informational text introduce students to the life cycle and migration of the sanderling, a bird that winters on beaches in the Southern United States and South America but breeds in the Arctic during the summer months. The text is written at a grade four through grade five reading level. This is a PDF containing the informational text and a glossary.

Subject:
Applied Science
Engineering
Geoscience
Physical Science
Technology
Material Type:
Reading
Provider:
Ohio State University College of Education and Human Ecology
Provider Set:
Beyond Penguins and Polar Bears: An Online Magazine for K-5 Teachers
Author:
Stephen Whitt
Date Added:
07/17/2010
Darwin Manuscripts Project
Read the Fine Print
Rating
0.0 stars

The AMNH Darwin Manuscripts Project is a historical and textual edition of Charles Darwin's scientific manuscripts, designed from its inception as an online project. The database at its core‰ŰÓDARBASE‰ŰÓcatalogues some 45,000 Darwin scientific manuscripts. These are currently represented by 15,125 high resolution digital images. Thus far 7,428 manuscript pages have been transcribed to exacting standards and all are presented in easy to read format. New material will be added.

Subject:
Geoscience
History
History, Law, Politics
Life Science
Physical Science
Material Type:
Data Set
Provider:
American Museum of Natural History
Provider Set:
American Museum of Natural History
Date Added:
10/15/2014
Data Review and Action Plan (Art for the Earth #5)
Conditional Remix & Share Permitted
CC BY-NC
Rating
0.0 stars

SYNOPSIS: In this lesson, students analyze data, create line graphs, conduct research, and plan their data art project.

SCIENTIST NOTES: This lesson builds students' data analysis and research skills. Students learn how to use data to create an appealing artwork that can explain and raise awareness on climate change impacts. All materials are properly sourced, and datasets for analysis are accurate. The lesson has passed our science credibility process.

POSITIVES:
-Students learn how to create a line graph that includes title, x-axis label, y-axis label, data points, and a line connecting the data points.
-Students think critically in their groups and in whole class discussions.
-Students practice media literacy skills when conducting research.

ADDITIONAL PREREQUISITES:
-This is lesson 5 of 6 in our 3rd-5th grade Art for the Earth unit.
-Students should have a basic understanding of data analysis and why graphs are useful tools to view data.
-You may have to guide students to good resources when they are conducting research on their topic in the Investigate section. A great tip when students are doing online research is to use the PARC method, which stands for Purpose, Author, Reliability, and Currency. Students can ask of every website:
-What is the purpose of this website?
-Who is the author of this website?
-Is this website reliable?
-Is this website current?

DIFFERENTIATION:
-It may be best for students to collaborate when creating their line graphs. Grouping students with varying levels of logical-mathematical intelligence and spatial-visual intelligence would probably work best.
-Line graphs can also be created using technology tools, including iPads or Chromebooks.
-Your students may or may not have different line graphs. If the data comes from a true class campaign, all students will have the same line graph. If students gathered their own data for different issues or used the different available data from NASA, their line graphs will be different.
-The Inspire section is meant for students to prepare to complete their projects. They will actually finish their projects in the sixth lesson in this unit after discussing more about the impact of art on one's feelings, how colours affect emotions, and how to appeal to different audiences.

Subject:
Arts and Humanities
Geoscience
Mathematics
Physical Science
Space Science
Visual Arts
Material Type:
Lesson Plan
Provider:
SubjectToClimate
Author:
Lindsey Pockl
Monica Lilley
Date Added:
06/28/2023
Data to Information
Read the Fine Print
Rating
0.0 stars

This lesson incorporates sea surface data collected by NASA satellites. Data for three surface characteristics- height, temperature and speed- are used for several activities. Students examine the differences in speed of currents relative to distance from the Equator. Sea surface data anomalies are charted and further analyzed. In addition, surface current data is presented to examine patterns related to El Niño. Note that this is lesson three of five on the Ocean Motion website. Each lesson investigates ocean surface circulation using satellite and model data and can be done independently. See Related URL's for links to the Ocean Motion Website that provide science background information, data resources, teacher material, student guides and a lesson matrix.

Subject:
Applied Science
Atmospheric Science
Engineering
Geoscience
Mathematics
Oceanography
Physical Science
Physics
Technology
Material Type:
Activity/Lab
Case Study
Data Set
Diagram/Illustration
Lesson Plan
Provider:
NASA
Provider Set:
NASA Wavelength
Date Added:
11/05/2014
Dead Diatoms Do Tell Tales
Read the Fine Print
Rating
0.0 stars

The students get to be climate detectives as they make a model of sediment cores using different kinds of glass beads and sand. They learn how to examine the types, numbers, and conditions of diatom skeletons in the model sediment cores and tell something about the hypothetical paleoclimate that existed when they were deposited.

Subject:
Geoscience
History
History, Law, Politics
Physical Science
Material Type:
Activity/Lab
Provider:
CLEAN: Climate Literacy and Energy Awareness Network
Provider Set:
CLEAN: Climate Literacy and Energy Awareness Network
Author:
ANDRILL
LuAnn Dahlman
Date Added:
10/27/2014
Deciviews from Look Rock, Great Smoky Mountains National Park: How Hazy is it?
Conditional Remix & Share Permitted
CC BY-NC-SA
Rating
0.0 stars

Spreadsheets Across the Curriculum/Geology of National Parks module. Students calculate the haze index and standard visual range from concentrations of particulate matter.

Subject:
Atmospheric Science
Geoscience
Physical Science
Material Type:
Activity/Lab
Provider:
Science Education Resource Center (SERC) at Carleton College
Provider Set:
Pedagogy in Action
Author:
Len VacherJ
Susan Sachs
im Renfro
Date Added:
11/06/2014
Deep Sea Vents Gallery
Read the Fine Print
Rating
0.0 stars

This online gallery of photos, illustrations, and videos provides a snapshot of deep sea vents and the ancient forms of life that can be found within them. Transcripts of the videos are provided, and the photos and illustrations are accompanied by explanatory texts.

Subject:
Ecology
Forestry and Agriculture
Geoscience
Life Science
Oceanography
Physical Science
Material Type:
Lecture
Reading
Teaching/Learning Strategy
Provider:
American Museum of Natural History
Provider Set:
American Museum of Natural History
Date Added:
02/16/2011
Deforestation and Climate Change (Water Cycle, Deforestation, and Climate Change #3)
Conditional Remix & Share Permitted
CC BY-NC
Rating
0.0 stars

SYNOPSIS: In this lesson, students learn how climate change and deforestation are linked to the water cycle.

SCIENTIST NOTES: This lesson provides students with a background on the relationship between deforestation, water cycle, erosion, and climate change. It establishes the fact that deforestation poses stress on the forest ecosystem and services, including impacting the water cycle and speeding up erosion and climate change. These issues could be addressed with well-informed adaptive strategies and action to restore the forest and biodiversity. All materials have been verified thoroughly, and this lesson has passed the science credibility process.

POSITIVES:
-Students participate in multiple interactive and hands-on learning activities to engage in kinesthetic, auditory, and visual learning.
-Students continue to better their understanding of how Earth’s natural systems are interconnected and dependent on each other.

ADDITIONAL PREREQUISITES:
-This is lesson 3 of 4 in our 6th-8th grade Water Cycle, Deforestation, and Climate Change unit.
-Materials required for the erosion model activity include the following:
-Scissors or sharp knife
-Clean, empty one-gallon container with a lid (such as a plastic milk jug)
-Water
-Two aluminum bread pans
-Dirt
-Two aluminum, 9-by-13-inch cake pans
-12 to 14 plastic forks
-Two blocks, shallow plastic containers, or other items of the same height to prop up the aluminum bread pans
-Outdoor test area with a flat, level surface where it is easy to clean spilled water and soil

DIFFERENTIATION:
-The erosion activity may be completed as a hands-on activity in lab groups or as a demonstration by the teacher.
-Lab groups may be in mixed abilities to aid in understanding.
-Teachers can prepare examples of diagrams for students to reference during the Inspire section.

Subject:
Geoscience
Physical Science
Space Science
Material Type:
Lesson Plan
Provider:
SubjectToClimate
Author:
Mallory Swafford
Date Added:
06/29/2023
Deforestation and Habitat Destruction (Art for the Earth #2)
Conditional Remix & Share Permitted
CC BY-NC
Rating
0.0 stars

SYNOPSIS: In this lesson, students learn about deforestation, analyze paintings featuring deforestation themes, and then have the choice to learn about Wangari Maathai or design a climate action plan related to deforestation.

SCIENTIST NOTES: The lesson allows students to explore the importance of reforestation to combat climate change. There are no scientific misconceptions in the lesson except for one instance in the Young Voices for the Planet video, which is embedded on slide 19 of the Teacher Slideshow. At 3 minutes, 35 seconds into the video, the boy Julian says, "We plant trees to help climate change." This is an error because we plant trees to fight climate change. All other materials are properly sourced. Thus, this lesson has passed our science credibility process.

POSITIVES:
-There is opportunity for a lot of peer and group discussion in this lesson.
-Students share their own thoughts and feelings about Jill Pelto's art, validating how they feel about deforestation and climate change.

ADDITIONAL PREREQUISITES:
-This is lesson 2 of 6 in our 3rd-5th grade Art for the Earth unit.
-A stable Internet connection is required to play the videos, especially the Google Earth timelapse video.
-Students should have some background knowledge on Jill Pelto, which you can find in lesson 1 of our Art for the Earth unit.

DIFFERENTIATION:
-This entire lesson lends itself to discussion. Group students accordingly so they can get the most out of this lesson.
-The Google Earth timelapse video of deforestation can be emotional to watch. Students may react with anger, sadness, fear, or shock. Tell them that those feelings are normal and natural. You can also tell them that you are learning about deforestation and climate change in order to do something about it. Empowering your students is one of the most powerful gifts you can give them.
-Some students may be eager to share their thoughts and feelings about Jill Pelto's art. Let them share with the class. Some students, however, may want to keep their feelings to themselves. That is OK too.
-The Inspire section of this lesson features a lot of student agency. Some students may want to learn more about Wangari Maathai and then be "done" with the deforestation part of this unit. Other students may want to design an action plan for your school or community. Perhaps they'd like to plant more trees on your school grounds. Support these students appropriately, and perhaps their efforts will lead to a greener, healthier, calmer school environment.

Subject:
Arts and Humanities
Geoscience
Physical Science
Space Science
Visual Arts
Material Type:
Lesson Plan
Provider:
SubjectToClimate
Author:
Lindsey Pockl
Monica Lilley
Date Added:
06/30/2023
Demonstration of radioactive decay using pennies
Conditional Remix & Share Permitted
CC BY-NC-SA
Rating
0.0 stars

A demonstration (with full class participation) to illustrate radioactive decay by flipping coins. Shows students visually the concepts of exponential decay, half-life and randomness. Works best in large classes -- the more people, the better.

(Note: this resource was added to OER Commons as part of a batch upload of over 2,200 records. If you notice an issue with the quality of the metadata, please let us know by using the 'report' button and we will flag it for consideration.)

Subject:
Biology
Geology
Geoscience
Life Science
Mathematics
Measurement and Data
Physical Science
Statistics and Probability
Material Type:
Simulation
Provider:
Science Education Resource Center (SERC) at Carleton College
Provider Set:
Teach the Earth
Author:
Jennifer Wenner
Date Added:
08/25/2019
Dendroclimatology in the Navajo Nation
Read the Fine Print
Educational Use
Rating
0.0 stars

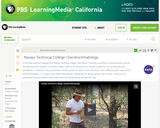
In this video segment adapted from Navajo Technical College, meet a dendroclimatologist who studies the relationship between precipitation and tree growth in the Navajo Nation.

Subject:
Applied Science
Ecology
Environmental Science
Forestry and Agriculture
Geoscience
Life Science
Physical Science
Space Science
Material Type:
Lesson
Provider:
PBS LearningMedia
Provider Set:
PBS Learning Media Common Core Collection
Author:
NASA
WGBH Educational Foundation
Date Added:
03/16/2012
Density, Buoyancy and Convection
Conditional Remix & Share Permitted
CC BY-NC-SA
Rating
0.0 stars

This 3-hour hands-on guided-discovery lab activity teaches students the concepts of density, buoyancy, thermal expansion and convection.

(Note: this resource was added to OER Commons as part of a batch upload of over 2,200 records. If you notice an issue with the quality of the metadata, please let us know by using the 'report' button and we will flag it for consideration.)

Subject:
Biology
Geoscience
Life Science
Physical Science
Physics
Material Type:
Activity/Lab
Provider:
Science Education Resource Center (SERC) at Carleton College
Provider Set:
Teach the Earth
Author:
Ann Bykerk-Kauffman
Date Added:
09/16/2022