Updating search results...

Search Resources

402 Results

View
Selected filters:
  • quantitative-reasoning
Math Review
Conditional Remix & Share Permitted
CC BY-NC-SA
Rating
0.0 stars

This is designed as an introductory lab for hydrogeology or other upper-level courses that are quantitative in nature in order to review key mathematical concepts that will be used throughout the semester.

Subject:
Mathematics
Measurement and Data
Statistics and Probability
Material Type:
Activity/Lab
Provider:
Science Education Resource Center (SERC) at Carleton College
Provider Set:
Teach the Earth
Author:
Kallina Dunkle
Date Added:
01/20/2023
Building Shaking âVariations of the BOSS Model
Conditional Remix & Share Permitted
CC BY-NC-SA
Rating
0.0 stars

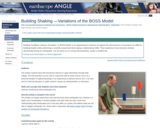
Building Oscillation Seismic Simulation, or BOSS, is an opportunity for learners to explore the phenomenon of resonance for different building heights while performing a scientific experiment that employs mathematical skills. They experience how structures behave dynamically during an earthquake.

(Note: this resource was added to OER Commons as part of a batch upload of over 2,200 records. If you notice an issue with the quality of the metadata, please let us know by using the 'report' button and we will flag it for consideration.)
Subject:
Applied Science
Biology
Engineering
Life Science
Mathematics
Measurement and Data
Statistics and Probability
Material Type:
Activity/Lab
Homework/Assignment
Provider:
Science Education Resource Center (SERC) at Carleton College
Provider Set:
Teach the Earth
Author:
IRIS (Incorporated Research Institutions for Seismology), FEMA (Federal Emergency Management Administration), ShakeAlert, Chris Hedeen (Oregon City High School), and ANGLE Project
Date Added:
09/26/2022
Alaska GPS Analysis of Plate Tectonics and Earthquakes
Conditional Remix & Share Permitted
CC BY-NC-SA
Rating
0.0 stars

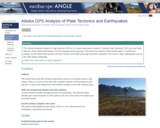
This activity introduces students to high precision GPS as it is used in geoscience research. Students build "gumdrop" GPS units and study data from three Alaska GPS stations from the Plate Boundary Observatory network. They learn how Alaska's south central region is "locked and loading" as the Pacific Plate pushes into North America and builds up energy that will be released in the future in other earthquakes such as the 1964 Alaska earthquake.

(Note: this resource was added to OER Commons as part of a batch upload of over 2,200 records. If you notice an issue with the quality of the metadata, please let us know by using the 'report' button and we will flag it for consideration.)
Subject:
Applied Science
Biology
Engineering
Life Science
Mathematics
Measurement and Data
Statistics and Probability
Material Type:
Activity/Lab
Provider:
Science Education Resource Center (SERC) at Carleton College
Provider Set:
Teach the Earth
Author:
Beth Pratt-Sitaula
Date Added:
09/26/2022
Tsunami Vertical Evacuation Structures (TVES)
Conditional Remix & Share Permitted
CC BY-NC-SA
Rating
0.0 stars

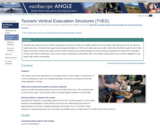
Students learn about tsunami vertical evacuation structures (TVES) as a viable solution for communities with high ground too far away for rapid evacuation. Students then apply basic design principles for TVES and make their own scale model that they think would fit will in their target community. Activity has great scope for both technical and creative design as well as practical application of math skills. Examples are from the Pacific Northwest, USA's most tsunami-vulnerable communities away from high ground, but it could be adapted to any region with similar vulnerability.

(Note: this resource was added to OER Commons as part of a batch upload of over 2,200 records. If you notice an issue with the quality of the metadata, please let us know by using the 'report' button and we will flag it for consideration.)
Subject:
Applied Science
Biology
Engineering
Life Science
Mathematics
Measurement and Data
Statistics and Probability
Material Type:
Activity/Lab
Provider:
Science Education Resource Center (SERC) at Carleton College
Provider Set:
Teach the Earth
Author:
Bonnie Magura (Portland Public Schools), Roger Groom (Mt Tabor Middle School), and CEETEP (Cascadia EarthScope Earthquake and Tsunami Education Program)
Date Added:
09/26/2022
Exploring Tectonic Motions with GPS
Conditional Remix & Share Permitted
CC BY-NC-SA
Rating
0.0 stars

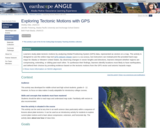
Using a map showing the horizontal velocities of GPS stations in the Plate Boundary Observatory and other GPS networks in Alaska and Western United States, students are able to describe the motions in different regions by interpreting the vectors resulting from long-term high-precision Global Positioning System (GPS) data.
Show more information on NGSS alignment
Hide
NGSS ALIGNMENT
Disciplinary Core Ideas
History of Earth: HS-ESS1-5
Earth' Systems: MS-ESS2-2
Earth and Human Activity: MS-ESS3-2, HS-ESS3-1
Science and Engineering Practices
4. Analyzing and Interpreting Data
5. Using Mathematics and Computational Thinking
6. Constructing Explanations and Designing Solutions
Crosscutting Concepts
4. Systems and System Models
7. Stability and Change

(Note: this resource was added to OER Commons as part of a batch upload of over 2,200 records. If you notice an issue with the quality of the metadata, please let us know by using the 'report' button and we will flag it for consideration.)
Subject:
Biology
Life Science
Mathematics
Measurement and Data
Statistics and Probability
Material Type:
Activity/Lab
Provider:
Science Education Resource Center (SERC) at Carleton College
Provider Set:
Teach the Earth
Author:
Shelley Olds
Date Added:
09/26/2022
Groundwater in Tampa FL on the Sulphur Springs Quadrangle
Conditional Remix & Share Permitted
CC BY-NC-SA
Rating
0.0 stars

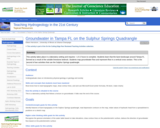
Groundwater accounts for only 0.75% of all water on Earth, yet it is a precious resource for the biosphere. In the United States, about one-fifth of the population taps into the groundwater reservoir of the hydrologic cycle as their main source of drinking water. However, worldwide, about 40% of all irrigation water comes from groundwater, and up to 80% of groundwater withdrawals are used for agriculture. Groundwater is also at risk and vulnerable to pollution, especially in areas with karst topography such as Tampa FL. Thus, the more people who understand the potential and the problems associated with groundwater, the better are the prospects for this resource.

Student materials for this exercise include a Microsoft Excel spreadsheet with with data for dye tests and elevations, a .zip archive with two versions of the topographic map (PDF and JPG), as well as the instruction sheet. The exercise is divided into three parts.

In Part I, students study the Sulphur Springs topographic quadrangle and identify features of karst topography on the map. This part of the exercise also reviews basic groundwater terminology.

Part II involves transferring hydraulic head information from Microsoft Excel to a simplified sketch map of the quadrange and drawing contour lines on the potentiometric surface. Next, students use the contour lines to add arrows indicating the direction of groundwater flow. Finally, students apply their knowledge to determine which lakes could be affected by a toxic spill within the quadrangle.

In Part III, students study the results of dye tests in the Sulphur Springs quadrangle to analyze the flow of groundwater. They also use elevation data to construct a vertical cross section that illustrates the ground surface, the water table, and the potentiometric surface for the Floridan aquifer, and they relate the cross section to features on the topographic map.

(Note: this resource was added to OER Commons as part of a batch upload of over 2,200 records. If you notice an issue with the quality of the metadata, please let us know by using the 'report' button and we will flag it for consideration.)
Subject:
Biology
Hydrology
Life Science
Mathematics
Measurement and Data
Physical Science
Statistics and Probability
Material Type:
Activity/Lab
Provider:
Science Education Resource Center (SERC) at Carleton College
Provider Set:
Teach the Earth
Author:
Eileen Herrstrom
Date Added:
03/30/2022
How are Flow Conditions in Volcanic Conduits Estimated?
Conditional Remix & Share Permitted
CC BY-NC-SA
Rating
0.0 stars

SSAC Physical Volcanology module. Students build a spreadsheet to calculate velocity of rising magma in steady-state Plinian eruptions using conservation of mass and momentum.

(Note: this resource was added to OER Commons as part of a batch upload of over 2,200 records. If you notice an issue with the quality of the metadata, please let us know by using the 'report' button and we will flag it for consideration.)
Subject:
Biology
Life Science
Mathematics
Measurement and Data
Statistics and Probability
Material Type:
Activity/Lab
Provider:
Science Education Resource Center (SERC) at Carleton College
Provider Set:
Teach the Earth
Author:
chuck connor
Date Added:
05/07/2018
What is the Volume of the 1992 Eruption of Cerro Negro Volcano, Nicaragua?
Conditional Remix & Share Permitted
CC BY-NC-SA
Rating
0.0 stars

SSAC Physical Volcanology module. Students build a spreadsheet to calculate the volume a tephra deposit using an exponential-thinning model.

(Note: this resource was added to OER Commons as part of a batch upload of over 2,200 records. If you notice an issue with the quality of the metadata, please let us know by using the 'report' button and we will flag it for consideration.)
Subject:
Biology
History
Life Science
Mathematics
Measurement and Data
Statistics and Probability
Material Type:
Activity/Lab
Provider:
Science Education Resource Center (SERC) at Carleton College
Provider Set:
Teach the Earth
Author:
chuck connor
Date Added:
09/01/2020
The Heat is On: Understanding Local Climate Change
Conditional Remix & Share Permitted
CC BY-NC-SA
Rating
0.0 stars

The is a curriculum module from the project Data Sets and Inquiry in Geoscience Education (DIGS). The module consists of a week-long unit and two-day performance assessment in which students apply the inquiry skills to problem-based investigations of urban micro-climates. The unit and performance assessment present semi-parallel tasks but about different cities (Phoenix and Chicago).

Sudents draw conclusions about the extent to which multiple decades of temperature data about Phoenix suggest that a shift in local climate is taking place as opposed to exhibiting nothing more than natural variability. The data are from the Global Climate Historical Network (GHCN) database. GHCN is a large, multi-year, international project to measure temperature, precipitation, and air pressure from near the ground. Each monthly maximum and minimum temperature is the highest and lowest temperature reading for the month, measured in Celsius. In Phoenix and in most other places, the temperature data are collected at local airports. The performance assessment for this module requires that students apply the methods and findings from the investigation of the climate data for Phoenix to climate data for Chicago. The Chicago data shows less evidence of trends in temperature change, and this is most evident comparing the night-time minimum temperature fluctuations between the two cities. Chicago also exhibits less increase in urban development and population growth than does Phoenix. In contrast to the curriculum unit, which primarily uses constructed-response tasks to encourage student explanation and discussion, the climate assessment tasks pose explicit selected- and constructed-response questions to ensure that the items elicit the intended thinking and hence provide evidence of the targeted standards-aligned skills and understandings.

(Note: this resource was added to OER Commons as part of a batch upload of over 2,200 records. If you notice an issue with the quality of the metadata, please let us know by using the 'report' button and we will flag it for consideration.)
Subject:
Applied Science
Biology
Environmental Science
History
Life Science
Mathematics
Measurement and Data
Statistics and Probability
Material Type:
Activity/Lab
Data Set
Lesson Plan
Provider:
Science Education Resource Center (SERC) at Carleton College
Provider Set:
Teach the Earth
Author:
Dan Zalles
Date Added:
12/01/2021
Unit 2: Monitoring surface and groundwater supply in central and western US
Conditional Remix & Share Permitted
CC BY-NC-SA
Rating
0.0 stars

In Unit 2, students learn how the techniques for water budgeting (covered in Unit 1) can be used to monitor both groundwater (High Plains Aquifer) and surface water (western mountain watershed) systems. Students interpret time-series plots that show the impact of drought years and wet years on underground water storage in the High Plains Aquifer and on snowpack and surface runoff in the western mountain watershed. They also consider the societal implications of water deficits through a series of pre-class readings, questions embedded in the assignments, and small and whole-group discussions. This unit can involve substantial computer time during which students use Excel to view and interpret hydrologic data. An alternative version with hard-copy graphs is also provided.

Show more about Online Teaching suggestions
Hide
Online-adaptable: Both parts of this unit are completely digital and thus at a logistical level it can be switched to online fairly easily. However, due to the relative complexity of the data investigations, there will still be quite a bit of instructor support needed and/or extended small group that should be arranged.

(Note: this resource was added to OER Commons as part of a batch upload of over 2,200 records. If you notice an issue with the quality of the metadata, please let us know by using the 'report' button and we will flag it for consideration.)
Subject:
Hydrology
Physical Science
Material Type:
Activity/Lab
Module
Provider:
Science Education Resource Center (SERC) at Carleton College
Provider Set:
Teach the Earth
Author:
Jonathan Harvey (Fort Lewis College) and Becca Walker (Mt San Antonio College)
Date Added:
09/26/2022
Floods on the Minnesota River
Conditional Remix & Share Permitted
CC BY-NC-SA
Rating
0.0 stars

Students explore the USGS water website to identify the location of stream gauges on the Minnesota River and the types of data that can be retrieved from the website. They determine which data to download based on the area of interest in the exercise (St. Peter, MN) and import historical flood data into MS Excel. The students use a spreadsheet to rank each flood and calculate a recurrence interval for a given flood, then estimate the discharge and stage of the 100-year flood in St. Peter, MN. The final task is to establish a flood hazard zone on a topographic map of the city of St. Peter. Note: this exercise can be applied to almost any non-dammed river with two or more USGS gaging stations on it. Go to http://water.usgs.gov and select your state from the pull-down menu to view an interactive map of your state's rivers and gaging station locations.

(Note: this resource was added to OER Commons as part of a batch upload of over 2,200 records. If you notice an issue with the quality of the metadata, please let us know by using the 'report' button and we will flag it for consideration.)

Subject:
Biology
Hydrology
Life Science
Mathematics
Measurement and Data
Physical Science
Statistics and Probability
Material Type:
Activity/Lab
Provider:
Science Education Resource Center (SERC) at Carleton College
Provider Set:
Teach the Earth
Author:
Ben Laabs
Date Added:
09/27/2022
Unit 2: Global Sea-Level Response to Temperature Changes: Temperature and Altimetry Data
Conditional Remix & Share Permitted
CC BY-NC-SA
Rating
0.0 stars

What is the contribution of seawater thermal expansion to recent sea-level rise? In this unit, students create time-series graphs of global averaged sea surface temperature anomaly (SSTA) data spanning 1880 -- 2017 and conduct linear trend analysis to assess SST change during this period. Based on the calculated SST change, students calculate how much sea-level rise occurred during 1993 -- 2015 due to thermal expansion of the oceans. Students compare their thermal expansion calculated sea-level rise results to observed sea-level rise from radar altimetry and assess how much sea-level rise is attributable to thermal expansion.

Show more about Online Teaching suggestions
Hide
Online-ready: The exercise is electronic and could be done individually or in small online groups. Lecture is best done synchronously due to the technical nature. Discussion would be better that way too.

(Note: this resource was added to OER Commons as part of a batch upload of over 2,200 records. If you notice an issue with the quality of the metadata, please let us know by using the 'report' button and we will flag it for consideration.)
Subject:
Applied Science
Biology
Environmental Science
Life Science
Mathematics
Measurement and Data
Statistics and Probability
Material Type:
Activity/Lab
Module
Provider:
Science Education Resource Center (SERC) at Carleton College
Provider Set:
Teach the Earth
Author:
Bruce Douglas
Susan Kaspari
Date Added:
01/04/2022
Watershed Analysis of Stream Morphology
Conditional Remix & Share Permitted
CC BY-NC-SA
Rating
0.0 stars

The goal of this activity is to provide students an opportunity to analyze the stream pattern and morphometric relationships of a particular watershed. Students will use topographic map analysis and data collection, along with analysis of data using Excel to characterize their watershed.
Designed for a geomorphology course

(Note: this resource was added to OER Commons as part of a batch upload of over 2,200 records. If you notice an issue with the quality of the metadata, please let us know by using the 'report' button and we will flag it for consideration.)
Subject:
Biology
Life Science
Mathematics
Measurement and Data
Statistics and Probability
Material Type:
Activity/Lab
Provider:
Science Education Resource Center (SERC) at Carleton College
Provider Set:
Teach the Earth
Author:
Holly Dolliver
Date Added:
09/02/2020
Weathering Rates
Conditional Remix & Share Permitted
CC BY-NC-SA
Rating
0.0 stars

A think-pair-share activity in which students calculate weathering rates from tombstone weathering data.

(Note: this resource was added to OER Commons as part of a batch upload of over 2,200 records. If you notice an issue with the quality of the metadata, please let us know by using the 'report' button and we will flag it for consideration.)
Subject:
Atmospheric Science
Biology
Life Science
Mathematics
Measurement and Data
Physical Science
Statistics and Probability
Material Type:
Activity/Lab
Data Set
Lesson Plan
Provider:
Science Education Resource Center (SERC) at Carleton College
Provider Set:
Teach the Earth
Author:
Rebecca Teed
Date Added:
09/04/2020
Unit 2: Application of Concepts to Case Studies
Conditional Remix & Share Permitted
CC BY-NC-SA
Rating
0.0 stars

In Unit 2, students apply and evaluate foundational concepts about storm hazards and risk in the context of two cases studies: Superstorm Sandy (2012) and the Storm of the Century (1993). Through different activities and assignments, students develop skills for finding, evaluating, and relating data to case studies and build an understanding of preparedness, response, and resilience. The activities include: an analysis of hazard mitigation plans for their local community, examination of storm-related geophysical processes in the context of societal risks, preparation of a press release for community preparedness, and a peer review and revision opportunity for the press releases. Instructors may also end this unit by having students revise their concept maps from Unit 1, applying lessons learned in Units 1 and 2.

(Note: this resource was added to OER Commons as part of a batch upload of over 2,200 records. If you notice an issue with the quality of the metadata, please let us know by using the 'report' button and we will flag it for consideration.)
Subject:
Atmospheric Science
Physical Science
Material Type:
Activity/Lab
Module
Provider:
Science Education Resource Center (SERC) at Carleton College
Provider Set:
Teach the Earth
Author:
Lisa Doner
Lorraine Motola
Patricia Stapleton
Date Added:
04/05/2022
Unit 5: Mitigating future disasters: developing a mass-wasting hazard map
Conditional Remix & Share Permitted
CC BY-NC-SA
Rating
0.0 stars

empty

(Note: this resource was added to OER Commons as part of a batch upload of over 2,200 records. If you notice an issue with the quality of the metadata, please let us know by using the 'report' button and we will flag it for consideration.)
Subject:
Applied Science
Environmental Science
Material Type:
Activity/Lab
Module
Provider:
Science Education Resource Center (SERC) at Carleton College
Provider Set:
Teach the Earth
Author:
Becca Walker
Date Added:
08/03/2022
Izmit Earthquake
Conditional Remix & Share Permitted
CC BY-NC-SA
Rating
0.0 stars

This lab allows students to look at variety of data from the North Anatolian fault in Turkey. Specifically, students have the oportunity to:

interpret seismograms from the Izmit earthquake in 1999 (while accessing some seismograph station information from IRIS)
make and interpret an earthquake focal mechanism solution based on these seismograms
locate the earthquake epicenter
calculate the moment magnitude of the earthquake using published data showing epicenter locations and displacement measurements
intepret historical data from the North Anatolian fault and tectonic-scale plate motion information to see what patterns occur in the regional seismicity.

(Note: this resource was added to OER Commons as part of a batch upload of over 2,200 records. If you notice an issue with the quality of the metadata, please let us know by using the 'report' button and we will flag it for consideration.)
Subject:
Biology
Geology
Life Science
Mathematics
Measurement and Data
Physical Science
Statistics and Probability
Material Type:
Activity/Lab
Provider:
Science Education Resource Center (SERC) at Carleton College
Provider Set:
Teach the Earth
Author:
Sarah Titus
Date Added:
09/05/2020
How Do We Know Where an Earthquake Originated?
Conditional Remix & Share Permitted
CC BY-NC-SA
Rating
0.0 stars

Students use real seismograms to determine the arrival times for P and S waves and use these times to determine the distance of the seismic station from the earthquake. Seismograms from three stations are provided to determine the epicenter using the S -- P (S minus P) method. Because real seismograms contain some "noise" with resultant uncertainty in locating arrival times of P and S waves, this activity promotes appreciation for uncertainties in interpretation of real scientific data.

(Note: this resource was added to OER Commons as part of a batch upload of over 2,200 records. If you notice an issue with the quality of the metadata, please let us know by using the 'report' button and we will flag it for consideration.)
Subject:
Biology
Life Science
Mathematics
Measurement and Data
Statistics and Probability
Material Type:
Activity/Lab
Provider:
Science Education Resource Center (SERC) at Carleton College
Provider Set:
Teach the Earth
Author:
Jeffrey Barker (Binghamton University) & Michael Hubenthal (IRIS)
Date Added:
09/26/2022
Heat Capacity of Minerals: A Hands-On Introduction to Chemical Thermodynamics
Conditional Remix & Share Permitted
CC BY-NC-SA
Rating
0.0 stars

Minerals are inorganic chemical compounds with a wide range of physical and chemical properties. Geologists frequently measure and observe properties such as hardness, specific gravity, color, etc. Unfortunately, students usually view these properties simply as tools for identifying unknown mineral specimens. One of the objectives of this exercise is to make students aware of the fact that minerals have many additional properties that can be measured, and that all of the physical and chemical properties of minerals have important applications beyond that of simple mineral identification.
Please do not let the title of this exercise scare you away. Introducing students to thermodynamics is not the primary objective. Getting students to "do" science - to observe, record, and interpret experimental data - is the primary goal. Heat capacity just happens to be a good vehicle for this purpose.

(Note: this resource was added to OER Commons as part of a batch upload of over 2,200 records. If you notice an issue with the quality of the metadata, please let us know by using the 'report' button and we will flag it for consideration.)
Subject:
Biology
Chemistry
Life Science
Mathematics
Measurement and Data
Physical Science
Physics
Statistics and Probability
Material Type:
Activity/Lab
Data Set
Homework/Assignment
Interactive
Provider:
Science Education Resource Center (SERC) at Carleton College
Provider Set:
Teach the Earth
Author:
David Bailey
Date Added:
09/09/2020
Lake Mixing Module
Conditional Remix & Share Permitted
CC BY-NC-SA
Rating
0.0 stars

Stratified lakes exhibit vertical gradients in organisms, nutrients, and oxygen, which have important implications for ecosystem structure and functioning. Mixing disrupts these gradients by redistributing these materials throughout the water column. Consequently, it is critical to understand the drivers of lake mixing and thermal stratification, especially because of the sensitivity of lake thermal conditions to altered climate. In this module, students will explore spatial and temporal patterns of lake mixing using high-frequency temperature data from lakes around the world. They will also explore how increases in air temperature affect thermal stratification by interpreting output from a lake model. Project EDDIE modules are designed with an A-B-C structure to make them flexible and adaptable to a range of student levels and course structures.

(Note: this resource was added to OER Commons as part of a batch upload of over 2,200 records. If you notice an issue with the quality of the metadata, please let us know by using the 'report' button and we will flag it for consideration.)
Subject:
Applied Science
Biology
Chemistry
Environmental Science
Hydrology
Life Science
Mathematics
Measurement and Data
Physical Science
Statistics and Probability
Material Type:
Activity/Lab
Provider:
Science Education Resource Center (SERC) at Carleton College
Provider Set:
Teach the Earth
Author:
This module was initially developed by Carey, C.C., J.L. Klug, and R.L. Fuller. 1 August 2015. Project EDDIE: Dynamics of Lake Mixing. Project EDDIE Module 3, Version 1. cemast.illinoisstate.edu/data-for-students/modules/lake-mixing.shtml. Module development was supported by NSF DEB 1245707.
Date Added:
09/19/2022