
This project will help students understand the validity of the electoral college.
- Subject:
- English Language Arts
- History
- Material Type:
- Activity/Lab
- Data Set
- Interactive
- Reading
- Date Added:
- 02/27/2017

This project will help students understand the validity of the electoral college.
For this experiment, students use a DC motor as a generator and various shaped turbine designs to test which design produces the most electrical power. Using a fan to generate the "wind", students attach different blades made of folded paper or card stock to the motor to see how much power is generated.
(Note: this resource was added to OER Commons as part of a batch upload of over 2,200 records. If you notice an issue with the quality of the metadata, please let us know by using the 'report' button and we will flag it for consideration.)
As the core activity of petrology portion of a mineralogy/petrology course, students cooperatively conduct petrographic and electron microprobe analytical studies on suites of Central Blue Ridge metamorphic rocks collected during class field activities. We make use of a remotely operable electron microprobe instrument at the Florida Center for Analytical Electron Microscopy (FCAEM) to conduct all analyses in class.
(Note: this resource was added to OER Commons as part of a batch upload of over 2,200 records. If you notice an issue with the quality of the metadata, please let us know by using the 'report' button and we will flag it for consideration.)

The interactions of electrons with matter have great explanatory power and are central to many technologies from transistors, diodes, smoke detectors, and dosemeters to sophisticated imaging, lasers, and quantum computing. A conceptual grasp of the interactions of electrons in general allows students to acquire deeper understanding that can be applied to a very broad range of technologies.

Use a series of interactive models and games to explore electrostatics. Learn about the effects positive and negative charges have on one another, and investigate these effects further through games. Learn about Coulomb's law and the concept that both the distance between the charges and the difference in the charges affect the strength of the force. Explore polarization at an atomic level, and learn how a material that does not hold any net charge can be attracted to a charged object. Students will be able to:
dragracer is an R package of data sets for all available seasons of RuPaul’s Drag Race, excluding All Stars. It’s updated at the end of each season. This blog post describes these data in some detail while also showcasing some of the things you can do with the provided. Steven Miller offers this R package for two reasons. First, the fandom for this show is large and there is a discernible subset of the fandom that is interested in the R programming language. He offers this package as a collection of accessible data with which they can experiment. He also offers this as a love letter of a kind to RuPaul’s Drag Race and all the contestants that have appeared on it.
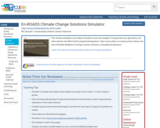
This climate simulation tool makes it intuitive to see how changes in energy, land use, agriculture, and other policies will affect Earth's projected temperature. Users move sliders on various policy actions and see immediate feedback on energy sources, emissions, and global temperature.
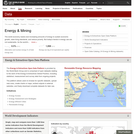
Data sets and graphs on energy production, use, dependency, and efficiency are compiled through following key World Development Indicators.
Students will be using real-life energy use data to learn how to use spreadsheets and create graphs to better organize and view data. Discussions can then follow to analyze the data and explain the usage. Real rates are then provided, and students can use the electricity consumed data to create a utility bill for the consumer and compare the standard Residential Service charges to if the member were instead billed by the “Time of Use” rate.
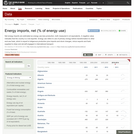
Data set and map pertaining to energy production for all countries. The World Bank specifies energy production as a World Development Indicator (WDI) -- the statistical benchmark that helps measure the progress of development.
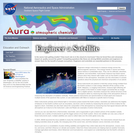
In this activity, learners select the scientific instruments for their satellite, calculate the power requirements for all the subsystems, and construct a scale model of their very own Earth observing satellite using building blocks and/or Legos. Includes instructions and worksheets.

English Language Learners
ELL students create and share a botanic field guide incorporating depiction, measurement, description, and classification of common Minnesota trees, shrubs, wildflowers, and plants.
This OER resource was created by Leo Sierra and as part of the 2024 World Language OER Summer work and training. Educators worked with Chrystal Liu, Nick Ziegler and Dorann Avey to create OER Learning Plans and materials. All textual content was created and developted with assistance from Chat GPT 3.5 and the ilustration was generated using Microsoft Copilot. The attached resource is designed for 9 - 12 World Language Arts teachers for Novice-High to Intermediate Low Learners of Spanish. This resource addresses the following NDE World Language Standard(s): NE WL WL 1.2.dIt is expected that this resource will take students 30 - 45 minutes depending on how it is presented.
This online directory of professional entomological societies covers the entire country. For each resource, contact information, including a link to its Web site, is provided. The list is divided into the following categories: general resources, national headquarters, Northeast, Mid-Atlantic, Southeast, South, Midwest, and California and Hawaii.
This online reference list provides links to nine local and national environmental organizations that have Web sites rich in valuable biodiversity information. Where possible, it includes the following information for each: details about the organization's mission, knowledge base, and activities; the type of support offered, including educational materials, resource libraries, and classes/workshops; and mailing address and contact information. In addition, links to four Web directories are provided, which in turn have links to dozens of other organizations.
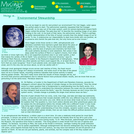
This online article, from the museum's Musings newsletter for educators, provides an introduction to environmental stewardship. It discusses Earth's rarity as a planet that supports life and the mounting evidence that indicates human activity is, indeed, altering global climate.
An activity designed to enable the students to access the impact of oil-development on environment in Alaska. Students will draw conclusion based on various data and reading various views.
(Note: this resource was added to OER Commons as part of a batch upload of over 2,200 records. If you notice an issue with the quality of the metadata, please let us know by using the 'report' button and we will flag it for consideration.)

"EVALUATION, VALUES, ENHANCEMENT"The Project involved 2 general education high schools, the Italian coordinator, and a Finnish partner: both have improved the quality of their provisions for learners through on-site (six) and virtual mobilities (two) for pupils and staff, increasing their ability to work in the framework of international projects. It has directly involved 100 people.The Project offered the opportunity:to reinforce the relevance of cooperation in an international context;to raise awareness of European citizenship and values;to share good practices.
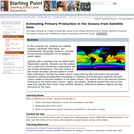
In this computer lab, students use satellite imagery, daylength information, and phytoplankton physiology models to calculate annual primary production for an assigned ocean region.
Satellite data is obtained from the NASA Earth Observation website. Students use the analysis tool to determine chlorophyll concentration and sea surface temperature. They also receive a day-length calculator and are asked to model light transmission through the water column. Using step-by-step instructions and proviede equations relating phytoplankton physiology to irradiance and temperature students calculate carbon uptake at discreet locations in the water column. The second half of the exercise involves scaling up to the entire water column, region, and season. Students present their work to the class and evaluate their result using scientific literature. Differences between regions are then discussed by the class.
(Note: this resource was added to OER Commons as part of a batch upload of over 2,200 records. If you notice an issue with the quality of the metadata, please let us know by using the 'report' button and we will flag it for consideration.)