Students will explore maps containing census data from 1950 through 2000. They …
Students will explore maps containing census data from 1950 through 2000. They will analyze how education levels and median household incomes have changed over time and determine how the two might be correlated. Students will also come up with ideas for policies that could help address issues related to income and education.
Students will examine how human actions and population changes can affect the …
Students will examine how human actions and population changes can affect the environment. Students will examine a series of photographs that compare famous landmarks (Times Square, the Saltair Pavilion in Utah, Laguna Beach, and Niagara Falls) across time, and then they will identify human-generated changes in the physical environment, such as the addition of bridges and roads. Students will also examine U.S. Census Bureau population and housing data to see how population changes can contribute to changes in the physical environment. In addition, students will describe the impact of these changes on the environment.
Students will participate in an online scavenger hunt based on a story …
Students will participate in an online scavenger hunt based on a story that a geographer named Gina, who loves to travel, has escaped to an undisclosed location. It is their mission to bring her back to the school. Students must follow a series of clues about the location including landmarks, weather, and population—and use a U.S. Census Bureau data tool called State Facts for Students to answer questions that lead them one step closer to finding Gina.
Students will use U.S. Census Bureau data to learn how population pyramids …
Students will use U.S. Census Bureau data to learn how population pyramids describe population structures and to calculate age range population percentages for a selected state that will help them create a population pyramid.
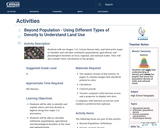
Students will use images, U.S. Census Bureau data, and interactive maps to …
Students will use images, U.S. Census Bureau data, and interactive maps to visualize and calculate arithmetic (population), agricultural, and physiological densities at local, regional, and national scales. They will also transfer their calculations to bar graphs.
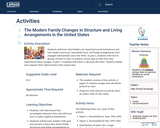
Students will learn why families are important social institutions and how family …
Students will learn why families are important social institutions and how family structures, household sizes, and living arrangements have changed substantially since the 1970s. In part 1, students will work in groups of three to four to analyze census data so that they may understand these changes. In part 2, students will watch a clip from the show “Modern Family” and compare their observations with census data.
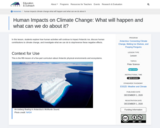
In this lesson, students explore how human activities will continue to impact …
In this lesson, students explore how human activities will continue to impact Antarctic ice, discuss human contributions to climate change, and investigate what we can do to stop/reverse these negative effects.
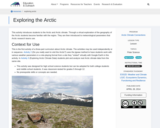
This activity introduces students to the Arctic and Arctic climate. Through a …
This activity introduces students to the Arctic and Arctic climate. Through a virtual exploration of the geography of the Arctic students become familiar with the region. They are then introduced to meteorological parameters that Arctic research teams use.
This lesson provides guidance for students to create and practice a presentation …
This lesson provides guidance for students to create and practice a presentation about design challenge results that they developed in the previous unit lessons and how to present it to the school administration.
This module teaches students about ozone’s role in the atmosphere and explores …
This module teaches students about ozone’s role in the atmosphere and explores authentic data to compare and contrast conditions that affect ground-level ozone values.
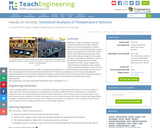
Working as if they are engineers aiming to analyze and then improve …
Working as if they are engineers aiming to analyze and then improve data collection devices for precision agriculture, students determine how accurate temperature sensors are by comparing them to each other. Teams record soil temperature data during a class period while making changes to the samples to mimic real-world crop conditions—such as the addition of water and heat and the removal of the heat. Groups analyze their collected data by finding the mean, median, mode, and standard deviation. Then, the class combines all the team data points in order to compare data collected from numerous devices and analyze the accuracy of their recording devices by finding the standard deviation of temperature readings at each minute. By averaging the standard deviations of each minute’s temperature reading, students determine the accuracy of their temperature sensors. Students present their findings and conclusions, including making recommendations for temperature sensor improvements.
This engineering design challenge is a great hands-on activity that utilizes the …
This engineering design challenge is a great hands-on activity that utilizes the engineering design process, 3D modeling, and 3D printing technology. The challenge can be completed individually or in groups of 2 to 3. Students will work to complete the following challenge: Using the design process, design, document, model, and produce a toy car with interchangeable parts.
Students will examine how technology is changing or eliminated careers that currently …
Students will examine how technology is changing or eliminated careers that currently exist. Students will draw conclusions and develop hypotheses about these current careers and the changes that could possibly occur based on technology.
The growing number of electronics that are becoming obsolete is staggering. The …
The growing number of electronics that are becoming obsolete is staggering. The responsible disposal of these materials remains to be a highly debated topic and is one that does not have an easy answer. In this problem-based learning module, students will research this growing issue and provide them opportunities to determine what actions to take. Students will then take their findings and use their research data as evidence to support their position. Groups will create a finished product in the form of a speech, radio broadcast, presentation or persuasive essay to help solve this problem.
Students are introduced to several types of common medical sensor devices, such …
Students are introduced to several types of common medical sensor devices, such as ear and forehead thermometers, glucometers and wrist blood pressure monitors; they use the latter to measure their blood pressure and pulse rates. Students also measure their heights and weights in order to calculate their BMIs (body mass index). Then they use the collected data to create and analyze scatterplots of the different variables to determine if any relationships exist between the measured variables. Discussions about the trends observed and possible health concerns conclude the activity.
This video lesson uses the technique of induction to show students how …
This video lesson uses the technique of induction to show students how to analyze a seemingly random occurrence in order to understand it through the development of a mathematical model. Using the medium of a simple game, Dr. Lodhi demonstrates how students can first apply the 'rules' to small examples of the game and then, through careful observation, can begin to see the emergence of a possible pattern. Students will learn that they can move from observing a pattern to proving that their observation is correct by the development of a mathematical model. Dr. Lodhi provides a second game for students in the Teacher Guide downloadable on this page. There are no prerequisites for this lesson and needed materials include only a blackboard and objects of two different varieties - such as plain and striped balls, apples and oranges, etc. The lesson can be completed in a 50-minute class period.
Increasingly, public agencies are adopting models of self-assessment in which administrative data …
Increasingly, public agencies are adopting models of self-assessment in which administrative data are used to guide and then continuously evaluate the implementation of programs and policies. In California, public child welfare agencies track performance outcomes spanning a range of child safety, permanency, and well-being domains, as dictated by federal and state mandates. This curriculum has been designed to provide Title IV-E and others students interested in public child welfare systems with an overview of the state’s Child Welfare Outcomes and Accountability System. Students will be provided with hands-on opportunities to become experienced and “statistically literate” users of aggregate, public child welfare data from the state’s administrative child welfare system, attending to the often missing link between data/research and practice. This curriculum is organized into five teaching modules, providing instructors with student learning activities, PowerPoint slide presentations, and other materials to support graduate IV-E students in the development of practical data analysis skills. Materials focus on publicly available data hosted through the Child Welfare Indicators Project at the University of California at Berkeley, a long-standing agency/university data partnership: http://cssr.berkeley.edu/ucb_childwelfare. CalSWEC funding for the development of this curriculum was provided to the Child Welfare Performance Indicators Project. Modules were developed to support instructors of both first- and second-year MSW research courses. Module objectives include: (a) to support student (and instructor) understanding of California's child welfare system performance goals and progress to date; (b) to develop students who have highly desirable (and practical) data analysis skills, including the ability to intelligibly distill and present numerical findings; and (c) to prepare a cohort of IV-E MSW students equipped to adopt leadership roles in county child welfare agencies, bringing with them an appreciation for how data can be used to improve practice and inform policies. Putnam-Hornstein, E., Needell, B., Lery, B., King, B., & Weigmann, W. (2013).
This curriculum, which can be used in whole or in part, provides …
This curriculum, which can be used in whole or in part, provides background legislative initiatives, evaluations of Family Preservation/Support Programs in different areas of the country, and techniques in evaluating community-based programs. Chapters include: a description of the development of Family Preservation/Family Support programs including key federal legislation and California's implementation process; a review of current literature on both family support and family preservation evaluations; a state-wide matrix of County Five-Year Plans for the Family Preservation/Support Program Initiative, summaries of 10 county Five-Year Plans, and case studies of three counties; information on single-subject designs including the nature and scope of single-subject research and its relationship to time-series design; information on collecting and analyzing administrative level data to determine whether change has occurred in a target community; and analysis of administrative level data within a single-system design framework. This module addresses Child Welfare Policy, Planning and Administration competencies. (343 pages)Rogers, K., Ferguson, C., Barth, R. P., & Embry, R. (1998).
Communicating With Data has a distinctive structure and content, combining fundamental quantitative …
Communicating With Data has a distinctive structure and content, combining fundamental quantitative techniques of using data to make informed management decisions with illustrations of how real decision makers, even highly trained professionals, fall prey to errors and biases in their understanding. We present the fundamental concepts underlying the quantitative techniques as a way of thinking, not just a way of calculating, in order to enhance decision-making skills. Rather than survey all of the techniques of management science, we stress those fundamental concepts and tools that we believe are most important for the practical analysis of management decisions, presenting the material as much as possible in the context of realistic business situations from a variety of settings. Exercises and examples drawn from marketing, finance, operations management, strategy, and other management functions.
No restrictions on your remixing, redistributing, or making derivative works. Give credit to the author, as required.
Your remixing, redistributing, or making derivatives works comes with some restrictions, including how it is shared.
Your redistributing comes with some restrictions. Do not remix or make derivative works.
Most restrictive license type. Prohibits most uses, sharing, and any changes.
Copyrighted materials, available under Fair Use and the TEACH Act for US-based educators, or other custom arrangements. Go to the resource provider to see their individual restrictions.