Updating search results...

Search Resources

1221 Results

View
Selected filters:
  • Statistics and Probability
What Soundproofing Material Works Best?
Read the Fine Print
Educational Use
Rating
0.0 stars

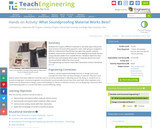
Students first explore different materials to see what types reduce the most amount of sound when placed in a box. Each group is assigned a different material and they fill their box with that specific material. Students measure the sound level of a tone playing from inside the box using a decibel reader from outside the box. Students share this data with the class and analyze which types of materials absorb the most sound and which reflect the most sound.

Subject:
Applied Science
Engineering
Mathematics
Measurement and Data
Physical Science
Statistics and Probability
Material Type:
Activity/Lab
Provider:
TeachEngineering
Provider Set:
Activities
Author:
Emma Cipriani
Geanna Schwaegerle
La’Nise Gray
Natalie Jackson
Date Added:
03/01/2019
What can zircons tell us about the Early Earth?
Conditional Remix & Share Permitted
CC BY-NC-SA
Rating
0.0 stars

A detailed two page Word document with activity instructions that can be tailored prior to handout. (Microsoft Word PRIVATE FILE 34kB Jun7 07)

Give students a synthetic data set (Excel PRIVATE FILE 38kB Jun7 07) of 206Pb/238U and 207Pb/235U isotope ratios. The data set will define two age populations (A and B) that can be assigned to either of the following scenarios. The data set is given to the students with the intention that Historical Geology level students will not be required to have advanced knowledge.

PART I: Data plotting
Students are to make concordia plots for use with the provided data sets (Excel PRIVATE FILE 38kB Jun7 07) using the plotting program Excel.

PART II: Data analysis
Data analysis. Experience the discovery of finding two age populations on a concordia plot. Discuss U-Pb concordance. Distinguish different populations using concordia diagram, discuss uncertainty in data.

PART III: Contextual basis
Introduce the two different scenarios (see below) for encountering the age populations A and B. Explore the implications of finding two different age populations within single grains from zircons in an igneous rock (i.e. zircon inheritance).
Explore the ability to discriminate different sedimentary components within a detrital population.
Explore what other aspects of zircon could be used to distinguish different age populations.

Question: What are you really dating when you analyze a zircon?

Two examples of the concept of multiple age populations:

Example 1: Discuss concept that zircons from an igneous rock can record multiple age populations (A and B) that result in grains with different age cores and rims. As a 'hook', illustrate this concept with images of well-known Early Earth examples, demonstrating that this exercise is a real-world problem.

Acasta gneiss zircons (images from S. Bowring)
Investigating the Jack Hills zircons (PowerPoint PRIVATE FILE 17.1MB Apr23 07) (images from A. Cavosie)
Wyoming province zircons (PowerPoint PRIVATE FILE 965kB Jun8 07) (images from D. Henry)

Example 2: Discuss concept of using zircon geochronology for sedimentary provenance. Use, as an example, two age populations (A and B, same data set as in ex. 1) of rounded detrital igneous zircons that end up in the same sedimentary rock. As a 'hook', illustrate this concept with images of well-known Early Earth examples

Field shots of Jack Hills siliciclastic sediments (images from A. Cavosie)
Field shots of Wyoming siliciclastic sediments (See #2 just above.)
Petrographic images (CL, BSE, TL, etc.) of the above.
Demonstrate that both Jack Hills and Wyoming zircons occur in siliciclastic rocks but are very different.

(Note: this resource was added to OER Commons as part of a batch upload of over 2,200 records. If you notice an issue with the quality of the metadata, please let us know by using the 'report' button and we will flag it for consideration.)
Subject:
Biology
Chemistry
Geology
Life Science
Mathematics
Measurement and Data
Physical Science
Statistics and Probability
Material Type:
Activity/Lab
Provider:
Science Education Resource Center (SERC) at Carleton College
Provider Set:
Teach the Earth
Author:
Aaron Cavosie
Darrell Henry
Julie Baldwin
Date Added:
12/26/2020
What do I want to be when I grow up?
Unrestricted Use
CC BY
Rating
0.0 stars

This is a PBL project used at the beginning of an Integrated Math course and is intended to help students identify gaps in their foundational knowledge and then fill those gaps by relating the topics to a real-world application in the context of what they want to do for their eventual career. Note that the project was designed and delivered per the North Carolina Math 2 curriculum and also references the North Carolina College Foundation website - both of these items can be customized to meet your own specific curriculum and college/career resources.

Subject:
Algebra
Geometry
Mathematics
Measurement and Data
Numbers and Operations
Statistics and Probability
Trigonometry
Material Type:
Lesson Plan
Author:
Ben Owens
Date Added:
10/15/2018
What is Magnitude? Earthquake Magnitude By Analogy
Conditional Remix & Share Permitted
CC BY-NC-SA
Rating
0.0 stars

This is a introductory lab exercise that is intended to convey the concept of the logarithmic scale used for earthquake magnitude. The students will visualize magnitude as a distance over the ground, by using a contrived conversion between magnitude and distance. Using distances helps the students understand how logarithmic scales, like magnitude, work because this is one of the few scales that students are familiar with that spans several orders of magnitude. Students typically use calculators to determine the distance associated with each magnitude. Maps should be provided in the lab/classroom that are on several scales: campus maps, city maps, state maps, and a national map work well. This activity gives the students practice in making unit conversions and in developing arguments by analogy.
Addresses student fear of quantitative aspect and/or inadequate quantitative skills
Addresses student misconceptions

(Note: this resource was added to OER Commons as part of a batch upload of over 2,200 records. If you notice an issue with the quality of the metadata, please let us know by using the 'report' button and we will flag it for consideration.)

Subject:
Biology
Business and Communication
Communication
Composition and Rhetoric
English Language Arts
Geology
Life Science
Mathematics
Measurement and Data
Physical Science
Statistics and Probability
Material Type:
Activity/Lab
Provider:
Science Education Resource Center (SERC) at Carleton College
Provider Set:
Teach the Earth
Author:
Scott White
Date Added:
09/05/2020
What is a paleontological species?
Conditional Remix & Share Permitted
CC BY-NC-SA
Rating
0.0 stars

In this two-part laboratory exercise, students explore the paleontological species concept by studying fossil rodent specimens and classifying them. This lab exercise follows a discussion of the species concept and is the first lab exercise in the course that gives students experience with fossil specimens. Part I: Students begin by studying casts of fossil mammal molars from which they construct clay models. This develops their ability to recognize the cusp pattern. Next, students are given 5 specimens that belong to a single species. First, they write qualitative descriptions of each specimen and then use an optical micrometer fitted to a microscope to collect data about molar length and width. Each group of students has a distinct species of the same rodent family, Ischyromyidae. Part II: The quantitative data is entered into a spreadsheet in Minitab, basic statistics are calculated and students plot molar length vs. width and/or molar area ln (LxW) vs. biostratigraphic level (if you want to include the time factor). (Class data is combined for the statistical analysis and graphing. An alternative approach, for a small class size, is to provide students with additional data points.) Each student pair must explain how they would classify each of the fossil specimens that they studied and the basis for their decision.

(Note: this resource was added to OER Commons as part of a batch upload of over 2,200 records. If you notice an issue with the quality of the metadata, please let us know by using the 'report' button and we will flag it for consideration.)
Subject:
Biology
Life Science
Mathematics
Measurement and Data
Statistics and Probability
Material Type:
Activity/Lab
Provider:
Science Education Resource Center (SERC) at Carleton College
Provider Set:
Teach the Earth
Author:
Deborah Anderson
Date Added:
09/04/2020
What is the Discharge of the Congaree River at Congaree National Park?
Conditional Remix & Share Permitted
CC BY-NC-SA
Rating
0.0 stars

Spreadsheets Across the Curriculum module/Geology of
National Parks course. Students use a rating curve to determine discharge at
various stage heights.

(Note: this resource was added to OER Commons as part of a batch upload of over 2,200 records. If you notice an issue with the quality of the metadata, please let us know by using the 'report' button and we will flag it for consideration.)
Subject:
Biology
Life Science
Mathematics
Measurement and Data
Statistics and Probability
Material Type:
Activity/Lab
Provider:
Science Education Resource Center (SERC) at Carleton College
Provider Set:
Teach the Earth
Author:
Denise Davis
Date Added:
12/29/2020
What is the Relationship between Lava Flow Length and Effusion Rate at Mt Etna?
Conditional Remix & Share Permitted
CC BY-NC-SA
Rating
0.0 stars

SSAC Physical Volcanology module. Students use Excel to determine a log-log relationship for flow length vs effusion rate and compare it with a theoretical expression for the maximum flow length.

(Note: this resource was added to OER Commons as part of a batch upload of over 2,200 records. If you notice an issue with the quality of the metadata, please let us know by using the 'report' button and we will flag it for consideration.)

Subject:
Biology
Life Science
Mathematics
Measurement and Data
Statistics and Probability
Material Type:
Activity/Lab
Provider:
Science Education Resource Center (SERC) at Carleton College
Provider Set:
Teach the Earth
Author:
chuck connor
Date Added:
09/09/2020
What is the Volume of a Debris Flow?
Conditional Remix & Share Permitted
CC BY-NC-SA
Rating
0.0 stars

SSAC Physical Volcanology module. Students build a spreadsheet to estimate the volume of volcanic deposits using map, thickness and high-water mark data from the 2005 Panabaj debris flow (Guatemala).

(Note: this resource was added to OER Commons as part of a batch upload of over 2,200 records. If you notice an issue with the quality of the metadata, please let us know by using the 'report' button and we will flag it for consideration.)
Subject:
Biology
Economics
History
Life Science
Mathematics
Measurement and Data
Social Science
Statistics and Probability
Material Type:
Activity/Lab
Provider:
Science Education Resource Center (SERC) at Carleton College
Provider Set:
Teach the Earth
Author:
chuck connor
Date Added:
09/10/2020
What is the Volume of the 1992 Eruption of Cerro Negro Volcano, Nicaragua?
Conditional Remix & Share Permitted
CC BY-NC-SA
Rating
0.0 stars

SSAC Physical Volcanology module. Students build a spreadsheet to calculate the volume a tephra deposit using an exponential-thinning model.

(Note: this resource was added to OER Commons as part of a batch upload of over 2,200 records. If you notice an issue with the quality of the metadata, please let us know by using the 'report' button and we will flag it for consideration.)
Subject:
Biology
History
Life Science
Mathematics
Measurement and Data
Statistics and Probability
Material Type:
Activity/Lab
Provider:
Science Education Resource Center (SERC) at Carleton College
Provider Set:
Teach the Earth
Author:
chuck connor
Date Added:
09/01/2020
What is the fate of CO2 produced by fossil fuel combustion?
Conditional Remix & Share Permitted
CC BY-NC-SA
Rating
0.0 stars

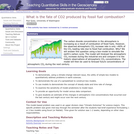
A box model is used to simulate the build up of carbon dioxide in the atmosphere during the industrial era and predict the future increase in atmospheric CO2 levels during the next century.

(Note: this resource was added to OER Commons as part of a batch upload of over 2,200 records. If you notice an issue with the quality of the metadata, please let us know by using the 'report' button and we will flag it for consideration.)
Subject:
Applied Science
Biology
Environmental Science
Geoscience
Life Science
Mathematics
Measurement and Data
Oceanography
Physical Science
Statistics and Probability
Material Type:
Activity/Lab
Data Set
Interactive
Provider Set:
Teach the Earth
Author:
Paul Quay
Date Added:
08/28/2019
When Does Aquifer Heterogeneity Matter? Predicting the Influence of Alternative Conceptual Models on Contaminant Plume Migration
Conditional Remix & Share Permitted
CC BY-NC-SA
Rating
0.0 stars

In this exercise, students predict changes in the movement of a dissolved plume in response to remedial pumping in an unconfined aquifer. The underlying conceptual model for the distribution of aquifer and aquitard materials is not known with certainty. Consequently, two alternative end-member conceptualizations are presented to students who are then asked to hypothesize differences in predicted responses at the pumping wells and nearby monitoring wells for each conceptual model. Predictions are compared to actual field data, and students discover that contaminant concentration measurements depend not only on the location of the observation point (in three dimensions), but also on the length of the screened interval through which water samples are collected. The activity is divided into three parts: (1) site/problem description, (2) formulation and testing of hypotheses for pumping wells, and (3) formulation and testing of hypotheses for monitoring wells. The activity gives students practice in three dimensional thinking and reinforces their intuitive understanding of contaminant plume migration in response to natural gradients and engineered stresses.

(Note: this resource was added to OER Commons as part of a batch upload of over 2,200 records. If you notice an issue with the quality of the metadata, please let us know by using the 'report' button and we will flag it for consideration.)
Subject:
Biology
Business and Communication
Hydrology
Life Science
Management
Mathematics
Measurement and Data
Physical Science
Political Science
Social Science
Statistics and Probability
Material Type:
Activity/Lab
Provider:
Science Education Resource Center (SERC) at Carleton College
Provider Set:
Teach the Earth
Author:
Larry Lemke
Date Added:
09/03/2020
When Predictions Fail: Crash Course Statistics #43
Read the Fine Print
Some Rights Reserved
Rating
0.0 stars

Today we’re going to talk about why many predictions fail - specifically we’ll take a look at the 2008 financial crisis, the 2016 U.S. presidential election, and earthquake prediction in general. From inaccurate or just too little data to biased models and polling errors, knowing when and why we make inaccurate predictions can help us make better ones in the future. And even knowing what we can’t predict can help us make better decisions too.

Subject:
Mathematics
Statistics and Probability
Material Type:
Lecture
Provider:
Complexly
Provider Set:
Crash Course Statistics
Date Added:
01/09/2019
When Predictions Succeed: Crash Course Statistics #44
Read the Fine Print
Some Rights Reserved
Rating
0.0 stars

In our series finale, we're going to take a look at some of the times we've used statistics to gaze into our crystal ball, and actually got it right! We'll talk about how stores know what we want to buy (which can sometimes be a good thing), how baseball was changed forever when Paul DePodesta created a record-winning Oakland A's baseball team, and how statistics keeps us safe with the incredible strides we've made in weather forecasting. Statistics are everywhere, and even if you don't remember all the formulae and graphs we've thrown at you in this series, we hope you take with you a better appreciation of the many ways statistics impacts your life, and hopefully we've given your a more math-y perspective on how the world works. Thanks so much for watching DFTBAQ!

Subject:
Mathematics
Statistics and Probability
Material Type:
Lecture
Provider:
Complexly
Provider Set:
Crash Course Statistics
Date Added:
01/09/2019
When Should I Drink My Hot Chocolate?
Read the Fine Print
Educational Use
Rating
0.0 stars

Students act as food science engineers as they explore and apply their understanding of cooling rate and specific heat capacity by completing two separate, but interconnected, tasks. In Part 1, student groups conduct an experiment to explore the cooling rate of a cup of hot chocolate. They collect and graph data to create a mathematical model that represents the cooling rate, and use an exponential decay regression to determine how long a person should wait to drink the cup of hot chocolate at an optimal temperature. In Part 2, students investigate the specific heat capacity of the hot chocolate. They determine how much energy is needed to heat the hot chocolate to an optimal temperature after it has cooled to room temperature. Two activity-guiding worksheets are included.

Subject:
Algebra
Chemistry
Mathematics
Physical Science
Statistics and Probability
Material Type:
Activity/Lab
Provider:
TeachEngineering
Provider Set:
TeachEngineering
Author:
Brian Palacios
Date Added:
02/17/2017
When and How Did Continental Crust Form?
Conditional Remix & Share Permitted
CC BY-NC-SA
Rating
0.0 stars

Given the extensive literature on the composition and evolution of continental crust there are a number of teaching strategies that can be employed to encourage active learning by students. A critical reading of this collection of articles will provide students with a good opportunity to evaluate the chemical isotopic and physical evidence that has led to the development of these models of continental crustal growth. These instructional approaches build on recommendations from Project 2061, Science for all Americans:
1) Start with questions about nature.
2) Engage students actively.
3) Concentrate onthe collection and use of evidence.
4) Provide historical perspectives.
5) Use a team approach.
6) Do not separate knowing from finding out.
A compilation from the primary literature has been provided (see the reference list at the end of this web page: http://serc.carleton.edu/NAGTWorkshops/earlyearth/questions/crust.html), along with guiding questions for deeper exploration and discovery. Recommended instructional methods include: jigsaw method, role playing or debates (have each student play the role of Richard Armstrong, Ross Taylor, William Fyfe...), reading the primary literature, or problem-based learning (which is purposefully ambiguous and addresses questions that require independent discovery).

(Note: this resource was added to OER Commons as part of a batch upload of over 2,200 records. If you notice an issue with the quality of the metadata, please let us know by using the 'report' button and we will flag it for consideration.)
Subject:
Biology
Chemistry
Geology
Life Science
Mathematics
Measurement and Data
Physical Science
Statistics and Probability
Material Type:
Activity/Lab
Provider:
Science Education Resource Center (SERC) at Carleton College
Provider Set:
Teach the Earth
Author:
Dave Mogk
Date Added:
09/08/2020
When is Dinner Served? Predicting the Spring Phytoplankton Bloom in the Gulf of Maine (College Level)
Conditional Remix & Share Permitted
CC BY-NC-SA
Rating
0.0 stars

College-level adaptation of the Earth Exploration Toolbook chapter. Students explore the critical role phytoplankton play in the marine food web.

(Note: this resource was added to OER Commons as part of a batch upload of over 2,200 records. If you notice an issue with the quality of the metadata, please let us know by using the 'report' button and we will flag it for consideration.)

Subject:
Biology
Life Science
Mathematics
Measurement and Data
Oceanography
Physical Science
Statistics and Probability
Material Type:
Activity/Lab
Provider:
Science Education Resource Center (SERC) at Carleton College
Provider Set:
Teach the Earth
Author:
Brian Welch
Date Added:
08/28/2019
Where Should I Live? Using U.S. Census Bureau Data to Make Decisions
Unrestricted Use
Public Domain
Rating
0.0 stars

Students will use the U.S. Census Bureau’s QuickFacts data access tool to examine information about three cities, including population, education, and income data. Students will draw conclusions about life in those three cities to determine which city they would like to live in as an adult.

Subject:
Mathematics
Statistics and Probability
Material Type:
Activity/Lab
Provider:
U.S. Census Bureau
Provider Set:
Statistics in Schools
Date Added:
10/16/2019
Where is that chunk of crust going?
Conditional Remix & Share Permitted
CC BY-NC-SA
Rating
0.0 stars

Introductory in-class session
I bring a hand-held GPS receiver into class, and present information about how the GPS receiver functions in coordination with the GPS satellites to define a position on Earth. I then talk about high-resolution GPS receivers, and introduce UNAVCO and the EarthScope Plate-Boundary Observatory. We visit the PBO website (http://pboweb.unavco.org) and find time-series data graphed for the motion of a given station (SBCC in Mission Viejo, California) relative to 3 orthogonal axes: north-south, east-west, and up-down. I hand-out paper copies of the data graphs, and we determine the slopes of the data to find the rate of change along each axis. We then use simple trigonometry to determine the length and direction of the 3-D velocity vector for that station. When we finish working on the first station's data together, we jointly write some rules for how to do the analysis. Then we use the rules to do a second analysis in class, working on data from a handout in groups of 2-3 students. The second station is BEMT in Twentynine Palms, California. The rules are refined as necessary and posted on the web. The results for SBCC and BEMT are then compared and discussed.

Homework portion
Students are required to find data for another PBO station and use the rules we developed to determine the velocity vector for that station. A report with the data and results of the analysis is due in the next class session. A sample report may be provided for their reference.

Classroom follow-up session
The results of the various analyses are compared, and questions generated about where various chunks of the lithosphere are going, how fast they are moving, and why they are moving. At the end, students are asked to write a few sentences describing what they would like to do next with the data -- what questions would they like to address through additional research work?

(Note: this resource was added to OER Commons as part of a batch upload of over 2,200 records. If you notice an issue with the quality of the metadata, please let us know by using the 'report' button and we will flag it for consideration.)

Subject:
Biology
Life Science
Mathematics
Measurement and Data
Statistics and Probability
Material Type:
Activity/Lab
Provider:
Science Education Resource Center (SERC) at Carleton College
Provider Set:
Teach the Earth
Author:
Vince Cronin
Date Added:
10/21/2021
Who Polluted Surface and Groundwater in This Place?
Conditional Remix & Share Permitted
CC BY-NC-SA
Rating
0.0 stars

Students are provided with a 3D perspective of a virtual place, descriptions of geologic and cultural aspects, and a table with water-table elevations in groundwater and contaminant levels in water wells, springs, and rivers. Students use these data to contour water-table elevations, determine the direction of groundwater flow, and identify industrial sites that are likely sources of contamination. They then propose a remediation plan and identify water wells that are likely to remain uncontaminated in the future.

(Note: this resource was added to OER Commons as part of a batch upload of over 2,200 records. If you notice an issue with the quality of the metadata, please let us know by using the 'report' button and we will flag it for consideration.)

Subject:
Chemistry
Hydrology
Mathematics
Measurement and Data
Physical Science
Statistics and Probability
Material Type:
Activity/Lab
Provider:
Science Education Resource Center (SERC) at Carleton College
Provider Set:
Teach the Earth
Author:
Steve Reynolds
Date Added:
09/16/2020