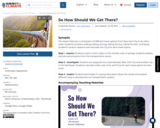
SYNOPSIS: This lesson features a comparison of different travel options from New York City to six other cities. Students compare walking, biking, driving, taking the bus, riding the train, and flying. Students conduct research and calculate the CO2e for each travel option.
SCIENTIST NOTES: The lesson explores emissions from the transportation system. Students would be able to learn how the society can decarbonize the transportation sector and compute the cost, time, and emissions from different transportation modes. There are no misconceptions in the data source and additional links. Thus, this lesson has passed our scientist review and is recommended for classroom use.
POSITIVES:
-This is a fun, imaginative, engaging lesson.
-This lesson features many math skills: addition, subtraction, multiplication, and division by rational numbers; estimation; logic and reasoning skills; problem-solving skills; and algebraic thinking.
ADDITIONAL PREREQUISITES:
-You will need to share the Student Slideshow with students and grant them editing rights before the lesson. Students will be writing in the Student Slideshow.
-Transportation is the largest sector of greenhouse gas emissions in the United States. We must decarbonize our transportation systems immediately to avoid the worst effects of climate change.
-Students use equations derived from Peter Kalmus’s book called Being the Change: Live Well and Spark a Climate Revolution.
-The Ford F-150 is used as the example vehicle because it is the best-selling vehicle in the United States. The unit CO2e is used for all travel options. CO2e is used because traveling by plane creates non-CO2 warming effects. You can read more about aviation’s non-CO2 warming effects at the Stay Grounded Website. So in order to best compare the pollution from these travel options, we must use the unit CO2e.
-CO2e is a metric measure used to compare the emissions from various greenhouse gases on the basis of their global warming potential (GWP), by converting amounts of other gases to the equivalent amount of carbon dioxide with the same global warming potential.
-There may not be an easy travel option for each route, so students might have to problem-solve.
-The "How is it viewed by society?" column in the data chart is meant for students to discuss society’s views of that method of transportation. Do people think it is crazy? Normal? Only for the rich? Is one method considered only for "poor people"? Is one considered trendy or cool? Is it comfortable to travel in that way? Is it easy or difficult? These are all good prompts to ask students.
-Encourage students to have an open mind when discussing low-carbon travel options, such as riding the bus or train. Some students may have never traveled long-distance by bus or train. These are low-carbon options that are significantly better for the planet than driving or flying.
DIFFERENTIATION:
-Students can use the provided glossary to better understand vocabulary.
-Students can answer the extension questions if they finish early.
-Students can help other groups complete their charts if they finish early.
-Students can check over other students’ answers if they finish early.
