This material is a detailed exercise for students in introductory statistics. Students …
This material is a detailed exercise for students in introductory statistics. Students are asked to collect a random sample of data from a real estate website; conduct descriptive statistics (including confidence intervals); and write a report summarizing their findings.
This text document lists detailed learning objectives for introductory statistics courses. Learning …
This text document lists detailed learning objectives for introductory statistics courses. Learning objectives are brief, clear statements of what learners will be able to perform at the end of a course.
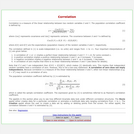
This 11-minute video lesson looks at the the central limit theorem and …
This 11-minute video lesson looks at the the central limit theorem and the sampling distribution of the sample mean. [Statistics playlist: Lesson 36 of 85]
This 13-minute video lesson provides analysis of variance 2: Calculating SSW and …
This 13-minute video lesson provides analysis of variance 2: Calculating SSW and SSB (total sum of squares within and between). [Statistics playlist: Lesson 76 of 85]
This course provides graduate students in the sciences with an intensive introduction …
This course provides graduate students in the sciences with an intensive introduction to applied statistics. Topics include descriptive statistics, probability, non-parametric methods, estimation methods, hypothesis testing, correlation and linear regression, simulation, and robustness considerations. Calculations will be done using handheld calculators and the Minitab Statistical Computer Software.
An analogy of the Earth's history to a cross-country drive. (Note: this …
An analogy of the Earth's history to a cross-country drive.
(Note: this resource was added to OER Commons as part of a batch upload of over 2,200 records. If you notice an issue with the quality of the metadata, please let us know by using the 'report' button and we will flag it for consideration.)
The applets in this section allow you to see how different bivariate …
The applets in this section allow you to see how different bivariate data look under different correlation structures. The Movie applet either creates data for a particular correlation or animates a multitude data sets ranging correlations from -1 to 1.
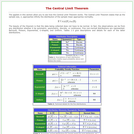
The applets in this section of Statistical Java allow you to see …
The applets in this section of Statistical Java allow you to see how the Central Limit Theorem works. The main page gives the characteristics of five non-normal distributions (Bernoulli, Poisson, Exponential, U-shaped, and Uniform).
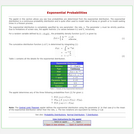
The applet in this section allows you see how probabilities are determined …
The applet in this section allows you see how probabilities are determined from the exponential distribution. The user determines the mean of the distribution and the limits of probability. Three different probability expressions are available.
This activity is part of the community collection of teaching materials on …
This activity is part of the community collection of teaching materials on climate and energy topics. This activity was submitted by faculty as part of the CLEAN Energy Workshop, held in April, 2011.
(Note: this resource was added to OER Commons as part of a batch upload of over 2,200 records. If you notice an issue with the quality of the metadata, please let us know by using the 'report' button and we will flag it for consideration.)
A box model is used to simulate the build up of carbon …
A box model is used to simulate the build up of carbon dioxide in the atmosphere during the industrial era and predict the future increase in atmospheric CO2 levels during the next century.
(Note: this resource was added to OER Commons as part of a batch upload of over 2,200 records. If you notice an issue with the quality of the metadata, please let us know by using the 'report' button and we will flag it for consideration.)
Project in which students calculate the magnitude of lunar and solar tidal …
Project in which students calculate the magnitude of lunar and solar tidal forces on the earth. They calculate the solar tidal effect relative to the lunar tidal effect and the relative solar tidal effect for spring-tide conditions.
(Note: this resource was added to OER Commons as part of a batch upload of over 2,200 records. If you notice an issue with the quality of the metadata, please let us know by using the 'report' button and we will flag it for consideration.)
These open-source mathematics homework problems are programmed for the WeBWorK mathematics platform …
These open-source mathematics homework problems are programmed for the WeBWorK mathematics platform and correspond to chapters in OpenStax Introductory Statistics. They were created through a Round Eight Textbook Transformation Grant.
This is a textbook for an Introduction to Statistics class. I use …
This is a textbook for an Introduction to Statistics class. I use it at a community college. The approach in this book is to develop an intuitive understanding of sampling distributions and inference in the first chapter so these can be used in the remainder of the book.
Cette ressource propose un recueil de diapos utilisées à l'UCL pour un …
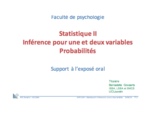
Cette ressource propose un recueil de diapos utilisées à l'UCL pour un cours de probabilités et statistique destiné à des étudiants en sciences humaines. Ce cours est précédé, à l'UCL, par un cours de statistique descriptive. N'hésitez pas à contacter l'auteur - bernadette govaerts@uclouvain.be - qui dispose de ressources complémentaires sur le sujet (énoncés d'exercices, jeux de données...). Contenu : - Eléments de Probabilités ° P1 : Introduction ° P2 : Calcul de probabilités sur des événements ° P3 : Variables aléatoires : généralités et lois classiques ° P4 : Théorème central limite et combinaisons de variables aléatoires -Inférence pour une et deux variables ° I1 : Principes de l’inférence statistique (rappels) ° I2 : Inférence sur les paramètres d’UNE variable quantitative normale ° I3 : Tests sur les paramètres d’une variable quantitative normale observée sur deux groupes indépendants ou pairés ° I4 : Inférence sur les paramètres d’une variable catégorielle ° I5 :Tests d’homogénéité et d’indépendance pour deux variables catégorielles ° I6 : Tests non paramétriques sur une ou deux valeurs centrales ° I7: Inférence sur un ou deux coefficients de corrélation ° I8 : Puissance d'un test, calcul de taille d'échantillon
No restrictions on your remixing, redistributing, or making derivative works. Give credit to the author, as required.
Your remixing, redistributing, or making derivatives works comes with some restrictions, including how it is shared.
Your redistributing comes with some restrictions. Do not remix or make derivative works.
Most restrictive license type. Prohibits most uses, sharing, and any changes.
Copyrighted materials, available under Fair Use and the TEACH Act for US-based educators, or other custom arrangements. Go to the resource provider to see their individual restrictions.