Updating search results...

Search Resources

144 Results

View
Selected filters:
  • earthquakes
The Plate Boundary Fault of the 2011 Tohoku Earthquake: Oceanic Provenance and Earthquake Genesis
Conditional Remix & Share Permitted
CC BY-NC-SA
Rating
0.0 stars

This is one component of the Seismogenic zone Experiment Mini Lessons
This mini lesson provides an example of how stratigraphy influences tectonics, and vice versa. The magnitude 9 Tohoku earthquake slipped a record 50m along a plate boundary fault comprised of extraordinarily weak smectite-rich pelagic clay [Chester et al., 2013; Ujiie et al., 2013, Fulton et al., 2013]. This clay may also have served as a slip surface for numerous large tsunami and tsunamigenic earthquakes along the subduction zone to the northeast, but it facilitated none along the Japan and Izu-Bonin Trenches to the south. During this lesson students will discover the probable reasons for this dichotomy.
Students will be supplied with locations of the Tohoku earthquake ocean drilling site (C0019) and the reference Site (436) as they are back tracked through Pacific Plate motions to their locations of origin. Students will construct the vertical sedimentary sequence that would occur, using Walther's Law (Prothero and Schwab, 1996, p. 329-330).

The student-reconstructed vertical sequence of sedimentary deposits will be compared to that at IODP Site 436. Site 436 includes a conspicuous interval of pelagic clay and is the oceanic reference site for Site C0019 drilled during Exp. 343. Students will compare the vertical succession of sediment lithologies hypothetically accumulated in their backtracked site to those observed at Sites 436, C0019 and others on the oceanic plate incoming to the subduction zone. Students will learn that smooth seafloor correlates with continuity of the pelagic clay layer, whereas, areas of rough seafloor (containing seamounts capped with carbonate and siliceous pelagic sediments) correlate with discontinuity of the pelagic clay layer. They will also learn that large earthquakes and tsunamis occur only in areas of more continuous incoming pelagic clay. Students will be able to speculate on the role of seamounts in interruption of the propagation of seismic slip (e.g. Wang and Bilek, 2011, 2014).

Subject:
Geology
Physical Geography
Physical Science
Material Type:
Activity/Lab
Provider:
Science Education Resource Center (SERC) at Carleton College
Provider Set:
Teach the Earth
Author:
(James) Casey Moore
Date Added:
01/20/2023
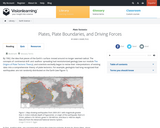
Plate Tectonics II: Plates, plate boundaries, and driving forces
Read the Fine Print
Educational Use
Rating
0.0 stars

The distribution of earthquakes and volcanoes around the world confirmed the theory of plate tectonics first proposed by Wegener. These phenomena also help categorize plate boundaries into three different types: convergent, divergent, and transform.

Subject:
Astronomy
Chemistry
Education
Geology
Geoscience
Physical Science
Physics
Space Science
Material Type:
Interactive
Unit of Study
Provider:
UCAR Staff
Provider Set:
Visionlearning
Author:
Anne Egger
Date Added:
03/18/2003
Plate Tectonics and People: Foundations of Solid Earth Science
Conditional Remix & Share Permitted
CC BY-NC-SA
Rating
0.0 stars

In this course we will explore topics from disciplines within the solid Earth sciences. In each lesson, we'll also touch on some ways the topic links to other scientific disciplines. Each unit is designed to present both the cutting-edge science as well as the background a secondary-school student (or her teacher) would need to place the research in context. Gaining an appreciation of how scientists choose the subjects they study is as fundamental to Earth science as the discovery of the facts themselves. You will learn appropriate state-of-the-art scientific content relevant to each topic by performing basic data analysis using publicly available data so that you will be able to use the data and lessons in any courses you teach.

Subject:
Applied Science
Environmental Science
Geology
Physical Science
Material Type:
Full Course
Provider:
Penn State College of Earth and Mineral Sciences
Author:
Eliza Richardson
Date Added:
10/07/2019
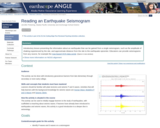
Reading an Earthquake Seismogram
Conditional Remix & Share Permitted
CC BY-NC-SA
Rating
0.0 stars

Introductory lesson that deconstructs the information that can be gleaned from a single seismogram.

(Note: this resource was added to OER Commons as part of a batch upload of over 2,200 records. If you notice an issue with the quality of the metadata, please let us know by using the 'report' button and we will flag it for consideration.)

Subject:
Biology
Life Science
Material Type:
Activity/Lab
Provider:
Science Education Resource Center (SERC) at Carleton College
Provider Set:
Teach the Earth
Author:
Jennifer Pickering
Date Added:
08/15/2022
Role playing the 2009 L'Aquila Earthquake and trial to debate responsibility for communicating and understanding risks and natural hazards
Conditional Remix & Share Permitted
CC BY-NC-SA
Rating
0.0 stars

In this activity, students reenact key events leading up to and following the 2009 L'Aquila Earthquake and trial. This leads into a debate on responsibility for communicating and understanding risks and natural hazards.

(Note: this resource was added to OER Commons as part of a batch upload of over 2,200 records. If you notice an issue with the quality of the metadata, please let us know by using the 'report' button and we will flag it for consideration.)

Subject:
Biology
Career and Technical Education
Environmental Studies
Geology
Life Science
Physical Science
Material Type:
Activity/Lab
Provider:
Science Education Resource Center (SERC) at Carleton College
Provider Set:
Teach the Earth
Author:
Amber Kumpf
Date Added:
02/02/2022
The Seismic Gap Hypothesis
Conditional Remix & Share Permitted
CC BY-NC-SA
Rating
0.0 stars

Using actual earthquake data from the circum-Pacific region, students make predictions about where earthquakes should occur in the immediate future. Data are provided in the form of global earthquake locations over 30 year time spans from 1900â2015. Students form groups and use one map to predict where earthquakes should occur during the subsequent 30 year interval. Students then compare their predictions to actual earthquake locations.

Subject:
Geology
Physical Science
Material Type:
Activity/Lab
Provider:
Science Education Resource Center (SERC) at Carleton College
Provider Set:
Teach the Earth
Author:
Walter Szeliga
Date Added:
01/20/2023
Seismic Sensations
Conditional Remix & Share Permitted
CC BY-NC
Rating
0.0 stars

Our school, Kelly Middle School, is one of the oldest middle school buildings in 4J (primary construction was completed in 1945). Each year we practice earthquake drills. Why? Why should we be concerned about earthquakes? Where might an earthquake occur in the northwest area? Might it be minor or violent? How might this be measured? Is an earthquake a singular event, or a series of events? What increases or decreases an earthquake hazard? Do we have any early-warning systems? Is the school earthquake drill correct? Considering these questions students need to develop an understanding of how to prepare for, and react to an earthquake event. When students are comfortably informed, who should they report to?

Subject:
Mathematics
Physical Science
Material Type:
Activity/Lab
Lesson Plan
Reading
Simulation
Teaching/Learning Strategy
Unit of Study
Provider:
Lane County STEM Hub
Provider Set:
Content in Context SuperLessons
Date Added:
06/20/2016
SeismicWaves Viewer & SeismicEruption Software
Conditional Remix & Share Permitted
CC BY-NC-SA
Rating
0.0 stars

This activity includes both the Seismic Waves Viewer and the Seismic Eruption software to help learners better understand earthquakes, volcanoes, and the structure of the Earth.

Seismic Waves is a browser-based tool to visualize the propagation of seismic waves from historic earthquakes through Earth's interior and around its surface. By carefully examining these seismic wave fronts and their propagation, the Seismic Waves tool illustrates how earthquakes can provide evidence that allows us to infer Earth's interior structure.

Seismic Eruption shows seismicity (earthquakes) and volcanic activity in space and time from 1960 to present. When the program is running, the user sees lights, which represent earthquakes, flashing on the screen in speeded-up time. The user can control the speed of the action. In addition, the program can show seismicity under Earth's surface in three-dimensional and cross-sectional views.

Earthquakes can be selected by magnitude and volcanic eruptions can be selected by volcanic explosivity index. In this way, large earthquakes and large eruptions can be selected to emphasize how different types of plate boundaries are characterized by different magnitudes of earthquakes (e.g. no major or great earthquakes occur on spreading ocean ridges). This lesson plan was developed by , Portland Oregon.

Students investigate how seismic waves travel through Earth's internal layers and bounce and bend at internal boundaries between mantle, outer core, and inner core.

(Note: this resource was added to OER Commons as part of a batch upload of over 2,200 records. If you notice an issue with the quality of the metadata, please let us know by using the 'report' button and we will flag it for consideration.)

Subject:
Biology
Life Science
Material Type:
Activity/Lab
Provider:
Science Education Resource Center (SERC) at Carleton College
Provider Set:
Teach the Earth
Author:
Roger Groom, Mt Tabor Middle School
Date Added:
09/26/2022
Shaking Ground - Linking Earthquake Magnitude and Intensity
Conditional Remix & Share Permitted
CC BY-NC-SA
Rating
0.0 stars

An in-class activity for connecting earthquake magnitude, shaking, and intensity.

(Note: this resource was added to OER Commons as part of a batch upload of over 2,200 records. If you notice an issue with the quality of the metadata, please let us know by using the 'report' button and we will flag it for consideration.)

Subject:
Biology
Life Science
Mathematics
Measurement and Data
Statistics and Probability
Material Type:
Activity/Lab
Provider:
Science Education Resource Center (SERC) at Carleton College
Provider Set:
Teach the Earth
Author:
Eric Baer
Date Added:
05/07/2018
Signal processing and earthquake triggering
Conditional Remix & Share Permitted
CC BY-NC-SA
Rating
0.0 stars

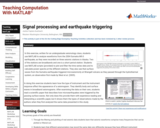
Seismograms of the 2004 M9.0 Sumatra earthquake, as recorded on station WANC on Wrnagell volcano, Alaska. The red signal shows the raw data and the blue represented data that have been lowpass filtered. The red spikes near 2800 s are local microearthquakes triggered by the passing of the surface waves.

Provenance: Jackie Caplan-Auerbach, Western Washington University
Reuse: This item is offered under a Creative Commons Attribution-NonCommercial-ShareAlike license http://creativecommons.org/licenses/by-nc-sa/3.0/ You may reuse this item for non-commercial purposes as long as you provide attribution and offer any derivative works under a similar license.

In this exercise, written for an undergraduate seismology class, students use MATLAB to analyze waveforms from the 2004 Sumatra M9.0 earthquake, as they were recorded on three seismic stations in Alaska. Two of the stations are broadbands and one is a short period station. Students use MATLAB scripts (provided) to plot and filter the time series data and to calculate power spectra at the different stations. They also see that surface waves from the Sumatra earthquake triggered microseismicity at Wrangell volcano as they passed through the hydrothermal system, an observation first made by West et al. (2005).

To view this video please enable JavaScript, and consider upgrading to a web browser that
supports HTML5 video


$( document ).ready(function() {
if(typeof videojs('flashv730083').analytics === 'function'){
videojs('flashv730083').analytics({
events: [
{
name: 'play',
label: 'video 137298',
action: 'play',
}
]
});
}
});

Click to watch Jackie Caplan-Auerbach discuss her activity or watch the full webinar.

In doing this exercise students learn how the type of instrument and the instrument response affect the appearance of a seismogram. They identify body and surface waves in broadband seismograms. After examining the data on their own, students read a scientific paper that describes how microearthquakes were triggered by the passing surface waves. Not only does this provide them with experience reading and interpreting a scientific paper, but it shows them the types of observations made by the authors when they first analyzed the same data presented in this study.

(Note: this resource was added to OER Commons as part of a batch upload of over 2,200 records. If you notice an issue with the quality of the metadata, please let us know by using the 'report' button and we will flag it for consideration.)

Subject:
Biology
Life Science
Mathematics
Measurement and Data
Physical Science
Physics
Statistics and Probability
Material Type:
Activity/Lab
Provider:
Science Education Resource Center (SERC) at Carleton College
Provider Set:
Teach the Earth
Author:
Jackie Caplan-Auerbach
Date Added:
09/30/2022
Stick-Slip Faulting and Earthquakes CogSketch geoscience worksheet
Conditional Remix & Share Permitted
CC BY-NC-SA
Rating
0.0 stars

This worksheet teaches students about stick-slip faulting and how earthquakes can be created in this environment. Students complete two tasks during this activity. In the first task, students trace the sticking point on two strike slip faults, e.g. a bend in the San Andreas fault. For the second task, students build a stress over time graph to show how stress builds up when a fault is locked, until it reaches a threshold where fast fault slip occurs with a release of energy (generating an earthquake). After which, the process starts over again.

This worksheet uses the sketch-understanding program with built-in tutor: CogSketch. Therefore, students, instructors, and/or institution computer labs need to download the program from here: http://www.qrg.northwestern.edu/software/cogsketch/. At any point during the worksheet, students can click the FEEDBACK button and their sketch is compared to the solution image. The built-in tutor identifies any discrepancies and reports pre-written feedback to help the student correct their sketch until they are done with the activity. Once worksheets are emailed to the instructor, worksheets can be batch graded and easily evaluated. This program allows instructors to assign sketching activities that require very little time commitment. Instead, the built-in tutor provides feedback whenever the student requests, without the presence of the instructor. More information on using the program and the activity is in the Instructor's Notes.

We have developed approximately two dozen introductory geoscience worksheets using this program. Each worksheet has a background image and instructions for a sketching task. You can find additional worksheets by searching for "CogSketch" using the search box at the top of this page. We expect to have uploaded all of them by the end of the summer of 2016.

(Note: this resource was added to OER Commons as part of a batch upload of over 2,200 records. If you notice an issue with the quality of the metadata, please let us know by using the 'report' button and we will flag it for consideration.)

Subject:
Biology
Life Science
Material Type:
Activity/Lab
Provider:
Science Education Resource Center (SERC) at Carleton College
Provider Set:
Teach the Earth
Author:
Bridget Garnier
Date Added:
09/03/2022
Student-centered Experiments on Earthquake Occurrence Using the Seismic/Eruption Program
Conditional Remix & Share Permitted
CC BY-NC-SA
Rating
0.0 stars

Students, working individually or in small groups, run the free Windows program Seismic/Eruption to generate maps from an earthquake database accurate and complete from 1960 to the present. Students select a seismically active region of interest to them and make their own map. They also select a time window, perhaps 20 years. By changing the minimum magnitude threshold setting in Seismic/Eruption and replaying the plots, they observe first-hand that large earthquakes occur less often than smaller magnitude earthquakes. The total number of earthquakes plotted is easily read from a counter on the screen. Students build up a table of the number of earthquakes per year with magnitude greater or equal to a certain magnitude, using a wide range of magnitude thresholds. These are then plotted on semi-log paper in the form of a Gutenberg-Richter plot. Connecting the points on the plot allows students to see a linear trend, to interpolate and extrapolate from the points measured, and to think about why there may be departures from that linear trend for very small and very large magnitudes. If they assume earthquake occurrence in their chosen region is equally distributed in time, they can predict how often an earthquake of a given magnitude is likely to occur. They can also replay Seismic/Eruption to see whether that assumption is valid.

(Note: this resource was added to OER Commons as part of a batch upload of over 2,200 records. If you notice an issue with the quality of the metadata, please let us know by using the 'report' button and we will flag it for consideration.)

Subject:
Biology
Life Science
Material Type:
Activity/Lab
Provider:
Science Education Resource Center (SERC) at Carleton College
Provider Set:
Teach the Earth
Author:
Jeffrey Barker
Date Added:
08/12/2019
Subduction Zone Earthquakes
Conditional Remix & Share Permitted
CC BY-NC-SA
Rating
0.0 stars

While working in groups to facilitate peer tutoring, students manipulate a hands-on, physical model to better comprehend several characteristics of subduction zone earthquakes.

(Note: this resource was added to OER Commons as part of a batch upload of over 2,200 records. If you notice an issue with the quality of the metadata, please let us know by using the 'report' button and we will flag it for consideration.)

Subject:
Biology
Geoscience
Life Science
Physical Science
Material Type:
Simulation
Provider:
Science Education Resource Center (SERC) at Carleton College
Provider Set:
Teach the Earth
Author:
David Steer
Date Added:
09/21/2022
Swiss Alps Emergency Sled Design
Read the Fine Print
Educational Use
Rating
0.0 stars

Students act as engineers to solve a hypothetical problem that has occurred in the Swiss Alps due to a seismic event. In research groups, students follow the steps of the engineering design process as teams compete to design and create small-size model sleds that can transport materials to people in distress who are living in the affected town. The sleds need to be able to carry various resources that the citizens need for survival as well as meet other design requirements. Students test their designs and make redesigns to improve their prototypes in order to achieve final working designs. Once the designs and final testing are complete, students create final technical reports.

Subject:
Applied Science
Engineering
Physical Science
Physics
Material Type:
Activity/Lab
Provider:
TeachEngineering
Provider Set:
Activities
Author:
Cynthia Dickman
Emma Cipriani
Shane Sullivan
Date Added:
11/13/2018
Tectonic Plates, Earthquakes, and Volcanoes
Read the Fine Print
Educational Use
Rating
0.0 stars

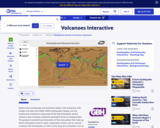
This interactive activity produced for Teachers' Domain shows the relationship between tectonic boundaries and the locations of earthquake events and volcanoes around the world.

Subject:
Astronomy
Chemistry
Education
Geology
Geoscience
Physical Science
Physics
Space Science
Material Type:
Activity/Lab
Data Set
Diagram/Illustration
Interactive
Provider:
PBS LearningMedia
Provider Set:
PBS Learning Media: Multimedia Resources for the Classroom and Professional Development
Author:
National Science Foundation
WGBH Educational Foundation
Date Added:
12/17/2005
Topographic differencing: Earthquake along the Wasatch fault
Conditional Remix & Share Permitted
CC BY-NC-SA
Rating
0.0 stars

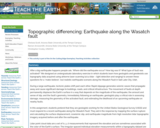
After a big earthquake happens people ask, 'Where did the earthquake occur? How big was it? What type of fault was activated?' We designed an undergraduate laboratory exercise in which students learn how geologists and geodesists use topography data acquired using airborne laser scanning (a.k.a lidar -- light detection and ranging) to answer these questions for a *make-believe*, but realistic earthquake scenario along the Wasatch Fault in Salt Lake City, Utah.

During a large earthquake, tectonic plates shift past each other. Rapid slippage generates seismic waves that propagate away and cause significant damage to buildings, roads, and critical infrastructure. The movement of faults at depth permanently displaces the Earth's surface in a way that depends on the magnitude of the earthquake, the amount and sense of slip, and the fault's geometry. Immediately following an earthquake, geologists play a critical role in assessing damage, measuring the geometry of the activated fault, and estimating the likelihood of an upcoming earthquake on nearby faults.Â

In this assignment, students pretend that they are geologists working for the United States Geological Survey (USGS) and must respond to a recent earthquake along the Wasatch Fault. They aid in the response by mapping the surface rupture and calculating the surface displacement, coseismic slip, and earthquake magnitude from high resolution lidar topographic imagery acquired before and after the earthquake.Â

Lidar point cloud data are a set of (x, y, z) measurements that represent the elevation and are sometimes associated with the color of the Earth's surface. The irregular-spaced individual elevation measurements within a topography dataset are often gridded into a digital elevation model (DEM) raster where the data are represented with rows and columns of pixels each with a height value. DEM's are often visualized as topographic hillshades, which mimic how the elevation would appear from above. Topographic differencing is a technique used to estimate 3D surface displacements from high-resolution topographic imagery acquired before and after an earthquake. The exercise includes pre- earthquake imagery acquired by the state of Utah in 2013-2014. The "post-earthquake" mimics the lidar imagery that would be acquired in the days to weeks following a major earthquake.Â

****** The earthquake in this exercise represents a hypothetical event. The 'post' event high resolution topography was synthetically displaced, in a way that simulates a possible earthquake along the Wasatch fault given mapped fault geometry and earthquake scaling laws. An event similar to the hypothetical earthquake here is possible: Since 1847 when pioneers settled in Salt Lake City, there have been over 16 earthquakes with magnitude greater than 5.5. Geologic studies show repeated large earthquakes occurred prior to European settlement in the region. Recently (March 18, 2020), the Salt Lake Valley was shaken by the M5.7 Magna earthquake. This recent reminder further motivates our exercise.******
Â
Keywords: Earthquakes, active tectonics, structural geology, geodesy, lidar, remote sensing


Provenance: Chelsea Scott, Arizona State University at the Tempe Campus
Reuse: This item is offered under a Creative Commons Attribution-NonCommercial-ShareAlike license http://creativecommons.org/licenses/by-nc-sa/3.0/ You may reuse this item for non-commercial purposes as long as you provide attribution and offer any derivative works under a similar license.

(Note: this resource was added to OER Commons as part of a batch upload of over 2,200 records. If you notice an issue with the quality of the metadata, please let us know by using the 'report' button and we will flag it for consideration.)

Subject:
Biology
Life Science
Material Type:
Activity/Lab
Provider:
Science Education Resource Center (SERC) at Carleton College
Provider Set:
Teach the Earth
Author:
Chelsea Scott
Date Added:
02/02/2022
Tsunami Vertical Evacuation Structures (TVES)
Conditional Remix & Share Permitted
CC BY-NC-SA
Rating
0.0 stars

Students learn about tsunami vertical evacuation structures (TVES) as a viable solution for communities with high ground too far away for rapid evacuation. Students then apply basic design principles for TVES and make their own scale model that they think would fit will in their target community. Activity has great scope for both technical and creative design as well as practical application of math skills. Examples are from the Pacific Northwest, USA's most tsunami-vulnerable communities away from high ground, but it could be adapted to any region with similar vulnerability.

(Note: this resource was added to OER Commons as part of a batch upload of over 2,200 records. If you notice an issue with the quality of the metadata, please let us know by using the 'report' button and we will flag it for consideration.)

Subject:
Applied Science
Biology
Engineering
Life Science
Mathematics
Measurement and Data
Statistics and Probability
Material Type:
Activity/Lab
Provider:
Science Education Resource Center (SERC) at Carleton College
Provider Set:
Teach the Earth
Author:
Bonnie Magura (Portland Public Schools), Roger Groom (Mt Tabor Middle School), and CEETEP (Cascadia EarthScope Earthquake and Tsunami Education Program)
Date Added:
09/26/2022
Understanding Earthquakes: Comparing seismograms
Conditional Remix & Share Permitted
CC BY-NC-SA
Rating
0.0 stars

Introductory lesson that contextualizes how multiple instruments provide a more complete picture on an event.

(Note: this resource was added to OER Commons as part of a batch upload of over 2,200 records. If you notice an issue with the quality of the metadata, please let us know by using the 'report' button and we will flag it for consideration.)

Subject:
Biology
Life Science
Material Type:
Activity/Lab
Provider:
Science Education Resource Center (SERC) at Carleton College
Provider Set:
Teach the Earth
Author:
Jennifer Pickering
Date Added:
08/15/2022
Unit 1: Earthquake!
Conditional Remix & Share Permitted
CC BY-NC-SA
Rating
0.0 stars

In this opening unit, students develop the societal context for understanding earthquake hazards using as a case study the 2011 Tohoku, Japan, earthquake. It starts with a short homework "scavenger hunt" in which students find a compelling video and information about the earthquake. In class, they share some of what they have found and then engage in a series of think-pair-share exercises to investigate both the societal and scientific data about the earthquake.

Show more about Online Teaching suggestions
Hide
Online-ready: This opening class discussion about earthquakes and societal impacts could easily be converted to an online discussion format.

(Note: this resource was added to OER Commons as part of a batch upload of over 2,200 records. If you notice an issue with the quality of the metadata, please let us know by using the 'report' button and we will flag it for consideration.)

Subject:
Biology
Career and Technical Education
Economics
Environmental Studies
Geology
Life Science
Physical Science
Social Science
Material Type:
Activity/Lab
Case Study
Module
Provider:
Science Education Resource Center (SERC) at Carleton College
Provider Set:
Teach the Earth
Author:
Vince Cronin, Baylor University (Vince_Cronin@baylor.edu) Phil Resor, Wesleyan University (presor@wesleyan.edu)
Date Added:
02/02/2022