Conditional Remix & Share Permitted
CC BY-NC-SA
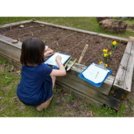
STUDENT ACTIVITY - 3rd - GA/TXThis is a distance-learning lesson students can complete at home. Students will measure plants and create bar graphs to compare data to actual mature plant heights.This activity was created by Out Teach (out-teach.org), a nonprofit providing outdoor experiential learning to transform Science education for students in under-served communities.
- Subject:
- Mathematics
- Material Type:
- Activity/Lab
- Author:
- Out Teach
- Date Added:
- 07/22/2021