Updating search results...

Search Resources

1126 Results

View
Selected filters:
  • biology
Rapid Response of Biologic Treatments of Moderate-to-Severe Plaque Psoriasis: A Comprehensive Investigation Using Bayesian and Frequentist Network Meta-analyses
Unrestricted Use
CC BY
Rating
0.0 stars

This resource is a video abstract of a research paper created by Research Square on behalf of its authors. It provides a synopsis that's easy to understand, and can be used to introduce the topics it covers to students, researchers, and the general public. The video's transcript is also provided in full, with a portion provided below for preview:

"Plaque psoriasis profoundly affects patients’ quality of life, underscoring the need for timely and effective treatments. Although several biologics are available to treat psoriasis, determining the best treatment option is difficult, as head-to-head comparisons of biologics are rare. To address that gap, researchers analyzed studies involving adults with moderate-to severe psoriasis treated with inhibitors of IL -17, IL-12/23, IL-23, or tumor necrosis factor. Thirty-three phase 3, double-blind, randomized, controlled trials were included in the analysis, which represented 11 biologics approved for the treatment of moderate-to-severe psoriasis in adults. This study focused on response rates in the first 12 weeks of treatment because rapid skin clearance and quality of life improvement are important patient preferences in biologic treatment..."

The rest of the transcript, along with a link to the research itself, is available on the resource itself.

Subject:
Applied Science
Health, Medicine and Nursing
Material Type:
Diagram/Illustration
Reading
Provider:
Research Square
Provider Set:
Video Bytes
Date Added:
11/16/2020
Reactions & Rates
Unrestricted Use
CC BY
Rating
0.0 stars

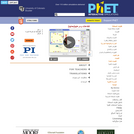
Explore what makes a reaction happen by colliding atoms and molecules. Design experiments with different reactions, concentrations, and temperatures. When are reactions reversible? What affects the rate of a reaction?

Subject:
Chemistry
Physical Science
Material Type:
Simulation
Provider:
University of Colorado Boulder
Provider Set:
PhET Interactive Simulations
Author:
Kathy Perkins
Linda Koch
Mindy Gratny
Ron LeMaster
Trish Loeblein
Date Added:
11/15/2007
Reactions & Rates (AR)
Unrestricted Use
CC BY
Rating
0.0 stars

Explore what makes a reaction happen by colliding atoms and molecules. Design experiments with different reactions, concentrations, and temperatures. When are reactions reversible? What affects the rate of a reaction?

Subject:
Chemistry
Physical Science
Material Type:
Simulation
Provider:
University of Colorado Boulder
Provider Set:
PhET Interactive Simulations
Author:
Kathy Perkins
Linda Koch
Mindy Gratny
Patricia Loblein
Ron LeMaster
Date Added:
12/02/2010
The Recent Roots of Dental Disease
Read the Fine Print
Some Rights Reserved
Rating
0.0 stars

Science has now provided an excuse for those of us used to being chided by our dentists for not brushing often enough: blame your cavities on the Industrial Revolution. New research suggests that the dietary changes associated with the Industrial Revolution 150 years ago (and with the invention of agriculture 10,000 years ago) caused an epidemic of tooth decay and gum disease. The culprits are oral bacteria. The human mouth is the native home of a wide variety of microbes, some helpful species and some harmful. Over the course of human history, eating more starch and sugar seems to have tipped the balance in favor of the disease-causing bacteria. Even without ultrasonic toothbrushes and mouthwashes, our ancestors may have had healthier teeth than we do!

Subject:
Biology
Life Science
Material Type:
Diagram/Illustration
Reading
Provider:
University of California Museum of Paleontology
Provider Set:
Understanding Evolution
Date Added:
03/01/2013
Red blood cells
Conditional Remix & Share Permitted
CC BY-NC-SA
Rating
0.0 stars

As taught Semesters 1 and 2, 2011

This learning object describes the structure and function and production of red blood cells. It is used as part of the level 1 Biological Sciences module delivered by the School of Nursing, Midwifery and Physiotherapy.

Dr Andy Meal, Lecturer in Biological Sciences, School of Nursing, Midwifery and Physiotherapy

Subject:
Life Science
Material Type:
Diagram/Illustration
Lesson
Provider:
University of Nottingham
Author:
Dr Andy Meal
Date Added:
03/24/2017
Renewable - But Is It Sustainable?
Conditional Remix & Share Permitted
CC BY-NC-SA
Rating
0.0 stars

Production of biofuels as an alternative energy source is not as simple as the media portray. This exercise enables students to practice critical thinking skills in evaluating the "value" of biofuels - a somewhat ambiguous concept.

(Note: this resource was added to OER Commons as part of a batch upload of over 2,200 records. If you notice an issue with the quality of the metadata, please let us know by using the 'report' button and we will flag it for consideration.)

Subject:
Biology
Career and Technical Education
Environmental Studies
Life Science
Material Type:
Activity/Lab
Provider:
Science Education Resource Center (SERC) at Carleton College
Provider Set:
Teach the Earth
Author:
Carol Burton, Bellevue Community College
Date Added:
12/09/2021
The Reproductive Role of Flowers
Read the Fine Print
Educational Use
Rating
0.0 stars

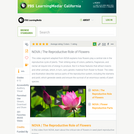
In this video segment adapted from NOVA, learn about the critical role of flowers in seed plant reproductive biology.

Subject:
Biology
Life Science
Material Type:
Lecture
Provider:
PBS LearningMedia
Provider Set:
PBS Learning Media: Multimedia Resources for the Classroom and Professional Development
Author:
The William and Flora Hewlett Foundation
WGBH Educational Foundation
Date Added:
08/26/2008
Resources: Data Management using National Ecological Observatory Network's (NEON) Small Mammal Data with Accompanying Lesson on Mark Recapture Analysis
Unrestricted Use
CC BY
Rating
0.0 stars

This version of this teaching module was published in Teaching Issues and Experiments in Ecology:

Jim McNeil and Megan A. Jones. April 2018, posting date. Data Management using National Ecological Observatory Network’s (NEON) Small Mammal Data with Accompanying Lesson on Mark Recapture Analysis. Teaching Issues and Experiments in Ecology, Vol. 13: Practice #9 [online]. http://tiee.esa.org/vol/v13/issues/data_sets/mcneil/abstract.html

*** *** ***

Undergraduate STEM students are graduating into professions that require them to manage and work with data at many points of a data management life cycle. Within ecology, students are presented not only with many opportunities to collect data themselves, but increasingly to access and use public data collected by others. This activity introduces the basic concept of data management from the field through to data analysis. The accompanying presentation materials mention the importance of considering long-term data storage and data analysis using public data.

This data set is a subset of small mammal trapping data from the National Ecological Observatory Network (NEON). The accompanying lesson introduces students to proper data management practices including how data moves from collection to analysis. Students perform basic spreadsheet tasks to complete a Lincoln-Peterson mark-recapture calculation to estimate population size for a species of small mammal. Pairs of students will work on different sections of the datasets allowing for comparison between seasons or, if instructors download additional data, between sites and years. Data from six months at NEON’s Smithsonian Conservation Biology Institute (SCBI) field site are included in the materials download. Data from other years or locations can be downloaded directly from the NEON data portal to tailor the activity to a specific location or ecological topic.

In this activity, students will:

- discuss data management practices with the faculty. Presentation slides are provided to guide this discussion.
- view field collection data sheets to understand how organized data sheets can be constructed.
- design a spreadsheet data table for transcription of field collected data using good data management practices.
- view NEON small mammal trapping data to a) see a standardized spreadsheet data table and b) see what data are collected during NEON small mammal trapping.
- use Microsoft Excel or Google Sheets to conduct a simple Lincoln-Peterson Mark-Recapture analysis to estimate plot level species population abundance.

Please note that this lesson was developed while the NEON project was still in construction. There may be future changes to the format of collected and downloaded data. If using data directly from the NEON Data Portal instead of using the data sets accompanying this lesson, we recommend testing out the data each year prior to implementing this lesson in the classroom.

This module was originally taught starting with a field component where students accompanied NEON technicians during the small mammal trapping. As this is not a possibility for most courses, the initial part of the lesson has been modified to include optional videos that instructors can use to show how small mammal trapping is conducted. Instructors are also encouraged to bring small mammal traps and small mammal specimens into the classroom where available.

The Data Sets

The National Ecological Observatory Network is a program sponsored by the National Science Foundation and operated under cooperative agreement by Battelle Memorial Institute. This material is based in part upon work supported by the National Science Foundation through the NEON Program.

The following datasets are posted for educational purposes only. Data for research purposes should be obtained directly from the National Ecological Observatory Network (www.neonscience.org).

Data Citation: National Ecological Observatory Network. 2017. Data Product: NEON.DP1.10072.001. Provisional data downloaded from http://data.neonscience.org. Battelle, Boulder, CO, USA

Notes
Version 2.1: Includes correct Lincoln-Peterson Index formula in PPT, faculty, and student notes.

Version 2.0: This version of the teaching module was published in Teaching Issues and Experiments in Ecology. McNeil and Jones 2018. This version reflects updates based on comments from reviewers.

Version 1.0: This version of the teaching module was prepared as part of the 2017 DIG FMN. It was submitted for publication as part of the DIG Special Issue of TIEE.

Cite this work
Researchers should cite this work as follows:

Jim McNeil, Megan A. Jones (2018). Data Management using National Ecological Observatory Network's (NEON) Small Mammal Data with Accompanying Lesson on Mark Recapture Analysis. NEON - National Ecological Observatory Network, (Version 2.1). QUBES Educational Resources. doi:10.25334/Q4M121

Subject:
Applied Science
Information Science
Material Type:
Activity/Lab
Data Set
Primary Source
Author:
George Mason University Smithsonian-mason School Of Conservation
Jim Mcneil
Megan A
National Ecological Observatory Network
Date Added:
12/21/2021
Resources: Introduction to Data Management and Metadata using NEON aquatic macroinvertebrate data
Unrestricted Use
CC BY
Rating
0.0 stars

Description
This lesson introduces students to working with metadata, which can be broadly thought of as the data ABOUT existing data. Data isn’t complete without metadata, and this lesson will help students understand both how to work with metadata and how to create their own.

Data used: NEON aquatic macroinvertebrate datasets from multiple stations. It could be adapted to use any data sets or taxonomic groups though.

Activities: The lesson involves three major activities. 1) Querying and downloading datasets and corresponding products from NEON. 2) Reading and answering comprehension questions about metadata files that correspond with data files 3) Combining two datasets based off understanding the metadata in exercise 2 (e.g. understanding which columns indicate sampling dates and in which formats will allow them to appropriately combine multiple data sets).

Programs: No specific programming skills or language is required for this lesson. This lesson is designed to be done entirely in common office/student software programs (e.g. Microsoft Word and Microsoft Office) and could be done using online programs (e.g. my university has student licenses for Google Spreadsheets and Google Docs).

Learning objectives:

1 – Students will be able to define ‘metadata’ and understand how metadata is critical for reproducible research.

2 – Students will be able to correctly answer comprehension questions about a metadata file.

3 – Students will be able to apply their understanding of the metadata file to create a new data file from two data sets.

4 – Students will understand the importance of creating and understanding metadata to go along with datasets.

Timing: This lesson was designed to take place in two – 75 minute class periods that are in a workshop format. This lesson could easily be part of a longer lab, homework, or a remote / online / asynchronous assignment.

Notes
This version is current as of Spring 2019 and was classroom taught. I encourage folks to adapt, modify, and make new versions.

Cite this work
Researchers should cite this work as follows:

Whitney, K. S. (2019). Introduction to Data Management and Metadata using NEON aquatic macroinvertebrate data. NEON Faculty Mentoring Network, QUBES Educational Resources. doi:10.25334/SJX1-F373

Subject:
Applied Science
Information Science
Material Type:
Activity/Lab
Primary Source
Author:
Kaitlin Stack Whitney
Rochester Institute Of Technology
Date Added:
12/18/2021
Resources: SEIR simulation activity for flattening the curve
Conditional Remix & Share Permitted
CC BY-SA
Rating
0.0 stars

This is a short exploration activity to introduce SIR and SEIR models without explicitly introducing differential equations. It utilizes the R package EpiDynamics and students can run the simulations themselves to observe flattening the curve.

Estimated time will vary. Please contact QUBESHub staff through the help ticket feature if you expect a large number of students to access the cloud-based tools at once.

Figure caption and headers are utilized to make this activity screen reader accessible, though RStudio itself is not yet screen reader accessible.

Subject:
Mathematics
Statistics and Probability
Material Type:
Activity/Lab
Author:
Bates College
Carrie Diaz Eaton
Date Added:
03/13/2020
Resources: Sizes, Scales and Specialization: Using Relative Proportions and Scientific Notation to Highlight the Diversity of Cell Types
Conditional Remix & Share Permitted
CC BY-SA
Rating
0.0 stars

Size, Scales, and Specialization was developed as part of an effort by the Quantitative Biology at Community Colleges group to provide materials that incorporate mathematical concepts into biology courses. The activity uses published estimates of cell type numbers in the human body along with size, density and weight as a lens to have students calculate ratios, explore exponents, and better understand how the various cell types contribute to an average human's total weight and size. The activity is applicable for majors and non-majors biology courses, and maps to Chapter 4 of the OpenStax Biology 2e textbook. This activity could also be used in a mathematics course as a biologically relevant example.

The activity contains a pre-assessment to gauge student understanding of the material and provides an opportunity for students to predict the number of various cell types, as well as the mass of various cell types, in the human body. This prediction activity is followed with a guided approach to calculating these values. After guiding the students in this activity, students will then have a chance to practice the activity on a new set of cell data provided.

After completing this module students should be able to:

- Compare and contrast the structure and function of different cell types.
-- List the largest and the smallest cells in the body based on number.
-- List the largest and the smallest cells in the body based on mass.
- Describe the advantages of specialization in eukaryotic cells.
-- Give examples of how specialization in cell types affects cell size (volume) and shape.
- Perform measurements and conversions using the metric system.
-- Measure the scale of cell size variation in the human body
-- Calculate the relative proportions of cell types in the human body by mass and frequency

Subject:
Algebra
Biology
Life Science
Mathematics
Material Type:
Activity/Lab
Data Set
Homework/Assignment
Author:
Heather Seitz
Jillian Marie Miller
Joseph Esquibel
Date Added:
04/23/2021
Resources: Why are Cells Small? Surface Area to Volume Ratio
Conditional Remix & Share Permitted
CC BY-SA
Rating
0.0 stars

Why are Cells Small? was developed as part of an effort by the Quantitative Biology at Community Colleges group to provide materials that incorporate mathematical concepts into biology courses. The activity was designed for a non-majors biology course, and maps to Chapter 4 of the OpenStax Biology 2e textbook. This activity could also be used in a mathematics course as a biologically relevant example.

After completing this module students should be able to:

- Explain the relationship of surface area to volume
- Describe the importance of a large surface area to volume ratio in the context of a living cell
- Calculate surface area of cubes and spheres
- Calculate volume of cubes and spheres
- Express two values as a ratio
- Enter data into a table
- Interpret Tables
- Create a graph
- Describe the axis labels on graphs
- Interpret graphs
This material is based upon work supported by the National Science Foundation under Grant No. 1919613. Any opinions, findings, and conclusions or recommendations expressed in this material are those of the author(s) and do not necessarily reflect the views of the National Science Foundation.

Subject:
Biology
Life Science
Mathematics
Material Type:
Activity/Lab
Homework/Assignment
Author:
Christianne Baucom Nieuwsma
John Howard Starnes
Sondra Marie Lore
Vedham Karpakakunjaram
Jennifer Glee Buntz
Date Added:
04/23/2021
Resources for Using PhET Simulations in Class  PhET Activities Database
Conditional Remix & Share Permitted
CC BY-NC-SA
Rating
0.0 stars

The PhET Activities Database is a collection of resources for using PhET sims. It includes hundreds of lesson plans, homework assignments, labs, clicker questions, and more. Some activities have been created by the PhET team and some have been created by teachers.

Subject:
Life Science
Physical Science
Material Type:
Activity/Lab
Simulation
Provider:
Science Education Resource Center (SERC) at Carleton College
Provider Set:
Starting Point (SERC)
Author:
Sam McKagan
Date Added:
08/28/2012
The Respiratory System of Birds
Conditional Remix & Share Permitted
CC BY-NC-SA
Rating
0.0 stars

This video aims to provide an illustrative lesson about the respiratory system in birds and how the adaptations of that system over time have made it different than that of other living creatures, especially mammals. Birds are omnipresent in our lives, and students will come to understand and appreciate the fascinating inner workings of these beautiful creatures. This lesson discusses avian features and differences for 20 to 25 minutes, with approximately 20 minutes of in-class student activities.

Subject:
Biology
Life Science
Material Type:
Lecture
Provider:
MIT
Provider Set:
MIT Blossoms
Author:
Seham Tahir Musa Al-Bohadja
Date Added:
02/13/2015
Resurveying California's Wildlife
Read the Fine Print
Rating
0.0 stars

In this video, students learn how scientific surveys of wildlife are performed at a site in Yosemite, California. These surveys, in conjunction with studies from the early 1900s, provide evidence that animal populations in Yosemite have shifted over time in response to rising temperatures.

Subject:
Life Science
Zoology
Provider:
CLEAN: Climate Literacy and Energy Awareness Network
Provider Set:
CLEAN: Climate Literacy and Energy Awareness Network
Author:
KQED
Teachers' Domain
Date Added:
10/27/2014
Ring of Investigation: What Will We Find?
Conditional Remix & Share Permitted
CC BY-NC-SA
Rating
0.0 stars

This activity is a field investigation where students gather data, draw detailed diagrams, and write descriptions about living organisms and non-living things seen in a small school ground area.

Subject:
Biology
Life Science
Material Type:
Activity/Lab
Provider:
Science Education Resource Center (SERC) at Carleton College
Provider Set:
Pedagogy in Action
Author:
Sheryl Tokarczyk
Date Added:
08/16/2012
Rocky Mountain Bio Lab: Wildflowers
Read the Fine Print
Rating
0.0 stars

This video explores the work of environmentalist John Hart, a Professor of Environmental Science at U.C. Berkley. In the Rocky Mountains of Colorado, Dr. Hart has established an experimental laboratory in which he has artificially created and maintained a 3-degree increase in surface temperature of a plot of land, and documented the impact on plant species occupying the plot.

Subject:
Geoscience
History
History, Law, Politics
Physical Science
Provider:
CLEAN: Climate Literacy and Energy Awareness Network
Provider Set:
CLEAN: Climate Literacy and Energy Awareness Network
Author:
National Geographic
Date Added:
10/27/2014
STAR: Software Tools for Academics and Researchers
Conditional Remix & Share Permitted
CC BY-NC-SA
Rating
0.0 stars

The Software Tools for Academics and Researchers (STAR) program at MIT seeks to bridge the divide between scientific research and the classroom. Understanding and applying research methods in the classroom setting can be challenging due to time constraints and the need for advanced equipment and facilities. The multidisciplinary STAR team collaborates with faculty from MIT and other educational institutions to design software exploring core scientific research concepts. The goal of STAR is to develop innovative and intuitive teaching tools for classroom use.
All of the STAR educational tools are freely available. To complement the educational software, the STAR website contains curriculum components/modules which can facilitate the use of STAR educational tools in a variety of educational settings. Students, teachers, and professors should feel welcome to download software and curriculum modules for their own use.
Online Publication

Subject:
Applied Science
Biology
Computer Science
Education
Educational Technology
Engineering
Environmental Science
Life Science
Physical Science
Physics
Material Type:
Full Course
Provider Set:
MIT OpenCourseWare
Author:
None, MIT Office of Educational Innovation and Technology
Date Added:
02/01/2012
Salmon Move into Deeper Waters
Read the Fine Print
Rating
0.0 stars

This video segment features subsistence fishing and harvesting in the Northwestern US. The segment was adapted from a student video produced at Northwest Indian College in Bellingham, Washington.

Subject:
Biology
Career and Technical Education
Ecology
Environmental Studies
Life Science
Oceanography
Physical Science
Provider:
CLEAN: Climate Literacy and Energy Awareness Network
Provider Set:
CLEAN: Climate Literacy and Energy Awareness Network
Author:
Teachers' Domain
WGBH
Date Added:
09/24/2018