Updating search results...

Search Resources

216 Results

View
Selected filters:
  • tectonics
Homework on Volcanic Rock Chemistry and Binary Phase Diagrams
Conditional Remix & Share Permitted
CC BY-NC-SA
Rating
0.0 stars

This homework has 2 main parts: In the first part, students are given bulk compositions for 6 volcanic rocks and asked to classify them, think about their normative compositions, and given likely tectonic settings for three of them. In the second part, they work with a complex binary phase diagram. In this part, they must think about components vs. phases, the lever rule, behavior at a peritectic point, and fractional removal of a phase. After completing this homework, I find that students are comfortable working with any binary diagram I give them.

(Note: this resource was added to OER Commons as part of a batch upload of over 2,200 records. If you notice an issue with the quality of the metadata, please let us know by using the 'report' button and we will flag it for consideration.)

Subject:
Biology
Chemistry
Life Science
Physical Science
Physics
Material Type:
Activity/Lab
Data Set
Lesson Plan
Provider:
Science Education Resource Center (SERC) at Carleton College
Provider Set:
Teach the Earth
Author:
Jane Selverstone
Date Added:
08/06/2019
Hotspot Lesson: Final Project
Conditional Remix & Share Permitted
CC BY-NC-SA
Rating
0.0 stars

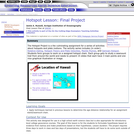
Students form groups to work on a assigned hotspot chain. Each group gets to study a seamount trail from around the world and needs to present 15 slides that each have 3 main points and one nice graphical illustration or image.

(Note: this resource was added to OER Commons as part of a batch upload of over 2,200 records. If you notice an issue with the quality of the metadata, please let us know by using the 'report' button and we will flag it for consideration.)
Subject:
Biology
Geoscience
Life Science
Physical Science
Material Type:
Lesson Plan
Provider:
Science Education Resource Center (SERC) at Carleton College
Provider Set:
Teach the Earth
Author:
Jamie A. Russell, Scripps Institution of Oceanography Related Links Relative Dating Hotspot Theory and Plate Velocities Mantle Plumes Samoan Hotspot View Lesson Plan at ERESE ...
Date Added:
08/29/2020
Hotspot Lesson: Hotspot Theory and Plate Velocities
Conditional Remix & Share Permitted
CC BY-NC-SA
Rating
0.0 stars

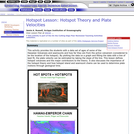
This activity provides the students with a data set of ages of some of the Hawaiian Volcanoes and seamounts and how far they are from the active volcanism (considered to be the location of the hotspot). By plotting the data on a graph and fitting the data with a line of best fit, the plate velocity can be estimated by taking the slope of the line.

(Note: this resource was added to OER Commons as part of a batch upload of over 2,200 records. If you notice an issue with the quality of the metadata, please let us know by using the 'report' button and we will flag it for consideration.)
Subject:
Biology
Geoscience
Life Science
Physical Science
Material Type:
Activity/Lab
Provider:
Science Education Resource Center (SERC) at Carleton College
Provider Set:
Teach the Earth
Author:
Jamie A. Russell, Scripps Institution of Oceanography Related Links Relative Dating Mantle Plumes Samoan Hotspot Final Hotspot Project View Lesson Plan at ERESE ...
Date Added:
08/29/2019
Hotspot Lesson: Samoan Hotspot
Conditional Remix & Share Permitted
CC BY-NC-SA
Rating
0.0 stars

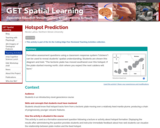
This lesson discusses the similarities and difference between Samoa and Hawaii. Both Samoa and Hawaii are island chains in the Pacific and thought to be the result of hotspots.

(Note: this resource was added to OER Commons as part of a batch upload of over 2,200 records. If you notice an issue with the quality of the metadata, please let us know by using the 'report' button and we will flag it for consideration.)
Subject:
Biology
Geoscience
Life Science
Physical Science
Material Type:
Activity/Lab
Provider:
Science Education Resource Center (SERC) at Carleton College
Provider Set:
Teach the Earth
Author:
Jamie A. Russell, Scripps Institution of Oceanography Related Links Relative Dating Hotspot Theory and Plate Velocities Mantle Plumes Final Hotspot Project View Lesson Plan at ERESE ...
Date Added:
08/29/2019
Hotspot Prediction
Conditional Remix & Share Permitted
CC BY-NC-SA
Rating
0.0 stars

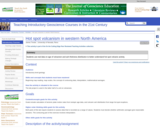
Yellowstone hotspot track

Provenance: Nicole LaDue, NIU

Formative assessment questions using a classroom response system ("clickers") can be used to reveal students' spatial understanding. Students are shown this diagram and told, "The tectonic plate has moved southwest over this hotspot. If the plate started moving north, click where you expect the next caldera will form."

(Note: this resource was added to OER Commons as part of a batch upload of over 2,200 records. If you notice an issue with the quality of the metadata, please let us know by using the 'report' button and we will flag it for consideration.)
Subject:
Biology
Life Science
Material Type:
Activity/Lab
Assessment
Provider:
Science Education Resource Center (SERC) at Carleton College
Provider Set:
Teach the Earth
Author:
Nicole LaDue
Date Added:
05/02/2022
Hot spot volcanism in western North America
Conditional Remix & Share Permitted
CC BY-NC-SA
Rating
0.0 stars

This lab project is in two parts. In the first part students are given a map of Snake River Plain volcanic centers with a range of dates of eruptions. Based on what they know about hot-spot tracks, they use the map and reported isotopic ages to calculate a range of values for the relative velocities of the North American Plate and the Yellowstone hot spot. In the second part, students are given a map of the distribution of a volcanic ash from the Yellowstone volcanic field, with thickness of the ash where known. Students are asked to contour the map to show how the ash is distributed, and think about the factors that affect that thickness, both during and after the eruption. In both parts of the lab students have to deal with real data that is incomplete in some cases, and usually occurs as a range of values. Students must make decisions about how to treat incomplete data sets that do not have absolute values.

(Note: this resource was added to OER Commons as part of a batch upload of over 2,200 records. If you notice an issue with the quality of the metadata, please let us know by using the 'report' button and we will flag it for consideration.)
Subject:
Biology
Life Science
Material Type:
Activity/Lab
Provider:
Science Education Resource Center (SERC) at Carleton College
Provider Set:
Teach the Earth
Author:
James Trexler
Date Added:
08/21/2019
Identifying Plate Tectonic Boundaries for a Virtual Ocean Basin
Conditional Remix & Share Permitted
CC BY-NC-SA
Rating
0.0 stars

Students observe a virtual ocean basin and two adjacent continental margins. From the characteristics of the sea floor and adjacent land, students infer where plate boundaries might be present. They then predict where earthquakes and volcanoes might occur. Finally, they draw their inferred plate boundaries in cross section.

(Note: this resource was added to OER Commons as part of a batch upload of over 2,200 records. If you notice an issue with the quality of the metadata, please let us know by using the 'report' button and we will flag it for consideration.)
Subject:
Biology
Geology
Life Science
Physical Science
Material Type:
Activity/Lab
Provider:
Science Education Resource Center (SERC) at Carleton College
Provider Set:
Teach the Earth
Author:
Steve Reynolds
Date Added:
08/16/2019
Igneous Rock Compositions and Plate Tectonics
Conditional Remix & Share Permitted
CC BY-NC-SA
Rating
0.0 stars

In this exercise, students use whole-rock major- and trace-element compositions of igneous rocks from a variety of tectonic settings and locations to explore the importance of plate setting in determining magma compositions. Students are split into groups and assigned different tectonic settings to examine and compare with other groups. Datasets are obtained from the GEOROC database, imported into Excel spreadsheets, and graphed to learn how igneous rock compositions are a function of plate tectonic setting.

(Note: this resource was added to OER Commons as part of a batch upload of over 2,200 records. If you notice an issue with the quality of the metadata, please let us know by using the 'report' button and we will flag it for consideration.)
Subject:
Biology
Geoscience
Life Science
Mathematics
Measurement and Data
Physical Science
Statistics and Probability
Material Type:
Activity/Lab
Data Set
Interactive
Lesson Plan
Provider:
Science Education Resource Center (SERC) at Carleton College
Provider Set:
Teach the Earth
Author:
Kent Ratajeski
Date Added:
08/20/2020
Igneous Rock Compositions and Plate Tectonics
Conditional Remix & Share Permitted
CC BY-NC-SA
Rating
0.0 stars

In this exercise, students are split into groups to gather whole-rock geochemical data (major-, trace-, and rare-earth elements) from the GEOROC database for igneous rocks sampled from four different plate tectonic settings: mid-ocean ridges, subduction zones, oceanic islands, and oceanic plateaus. Each group is assigned a different plate tectonic setting and collects three datasets from different locations for their tectonic setting. Geochemical data is graphed as major-element variation and REE diagrams to quantify igneous diversity both within the same tectonic setting and between different tectonic settings. The main goal of this exercise is to demonstrate that igneous rock compositions are a strong function of plate tectonic setting.

(Note: this resource was added to OER Commons as part of a batch upload of over 2,200 records. If you notice an issue with the quality of the metadata, please let us know by using the 'report' button and we will flag it for consideration.)
Subject:
Biology
Chemistry
Life Science
Mathematics
Measurement and Data
Physical Science
Statistics and Probability
Material Type:
Activity/Lab
Data Set
Lesson Plan
Provider:
Science Education Resource Center (SERC) at Carleton College
Provider Set:
Teach the Earth
Author:
Allen Glazner
Date Added:
08/18/2020
Igneous Rocks Research Project
Conditional Remix & Share Permitted
CC BY-NC-SA
Rating
0.0 stars

In this project, students work in small groups to formally characterize an aspect of a local igneous rock, based on petrography, hand sample descriptions, and SEM and/or CL analyses. Students have two lab sessions and a field trip dedicated to working on this suite of rocks: one for detailed petrographic analyses and another SEM or CL imaging and analysis. The field trip is the field component of the project. The individual labs are ungraded, but all are required for completion of the project.

Papers must include the following sections:
Introduction, Geologic History, Petrography, Chemical Analysis, Discussion, References, Appendix (contains copies of ALL notes, calculations, drafts and revisions)

(Note: this resource was added to OER Commons as part of a batch upload of over 2,200 records. If you notice an issue with the quality of the metadata, please let us know by using the 'report' button and we will flag it for consideration.)

Subject:
Biology
Chemistry
Life Science
Physical Science
Material Type:
Activity/Lab
Homework/Assignment
Provider:
Science Education Resource Center (SERC) at Carleton College
Provider Set:
Teach the Earth
Author:
Sarah Carmichael
Date Added:
08/20/2019
Immaterial Limits: Process and Duration
Conditional Remix & Share Permitted
CC BY-NC-SA
Rating
0.0 stars

This studio proposes to engage tectonics as a material process. By exploring transformation, indeterminacy and mutability inherent in material and landscape processes, students will be challenged to engage notions of duration as a design strategy for architecture and urbanism. While the second law of thermodynamics states that the material universe tends toward a state of increasing disorder, architects build and construct in opposition to these forces. Attempting to delay the processes of disorder, decay and collapse, tectonics is often seen as the embodied expression of an arrested moment the finite resolution of the building process. Yet the processes that enable and disable architecture extend beyond any arrested moment.
A more detailed description can be found in the syllabus section.

Subject:
Applied Science
Architecture and Design
Material Type:
Full Course
Provider Set:
MIT OpenCourseWare
Author:
Yoon, Meejin
Date Added:
09/01/2002
Increase in volcanism at the beginning of the Holocene on Reykjanes, Iceland: case example
Conditional Remix & Share Permitted
CC BY-NC-SA
Rating
0.0 stars

Students make simple stress calculations to determine whether deglaciation at the end of the Pleistocene may have been responsible for a short but dramatic increase in rates of volcanism on Reykjanes in Iceland as a result of depressurization of the underlying mantle.

(Note: this resource was added to OER Commons as part of a batch upload of over 2,200 records. If you notice an issue with the quality of the metadata, please let us know by using the 'report' button and we will flag it for consideration.)
Subject:
Applied Science
Biology
Environmental Science
Life Science
Material Type:
Activity/Lab
Provider:
Science Education Resource Center (SERC) at Carleton College
Provider Set:
Teach the Earth
Author:
Barb Tewksbury
Date Added:
08/10/2019
Introduction to Hazard and Risk: Part 2
Conditional Remix & Share Permitted
CC BY-NC-SA
Rating
0.0 stars

Students continue their introduction to Excel by building spreadsheets that estimate the risk of a major earthquake along the Cascadia Subduction Zone to Benton County, Oregon.

Subject:
Geology
Geoscience
Physical Science
Material Type:
Activity/Lab
Provider:
Science Education Resource Center (SERC) at Carleton College
Provider Set:
Pedagogy in Action
Author:
Tom Juster
Date Added:
11/06/2014
Introduction to Physical Geography OER Course
Conditional Remix & Share Permitted
CC BY-NC
Rating
0.0 stars

GEO 131: Introduction to Physical Geography is an OER course that provides a comprehensive overview of Earth's natural systems and the forces that shape its physical landscape. Students will explore key topics such as weather, climate, hydrology, ecology, geology, and tectonics. Through both lectures and hands-on lab exercises, students will examine the processes of volcanism, erosion, soil formation, and glaciation, and learn to apply geographic theories to real-world issues. The course emphasizes understanding the distribution of natural features and the scientific principles that explain Earth's physical geography.

Subject:
Education
Physical Geography
Material Type:
Full Course
Author:
Linda Neff
Duane Marshall
Duane Marshall
Date Added:
09/23/2024
Introduction to Plate Tectonics
Conditional Remix & Share Permitted
CC BY-NC-SA
Rating
0.0 stars

In this lab students interpret bathymetric, topography, sea floor ages, and earthquake distributions to reinforce concepts about the different types of plate boundaries. Each student must interpret several sets of data to determine the location and type of plate boundary. To develop a set of basic analytical skills, the students draw several diagrams and graphs to reinforce the data presented in figures. Students are also asked to think critically about plate rates and what happens to the crust at the different plate boundaries. This activity uses online and/or real-time data and has minimal/no quantitative component.

(Note: this resource was added to OER Commons as part of a batch upload of over 2,200 records. If you notice an issue with the quality of the metadata, please let us know by using the 'report' button and we will flag it for consideration.)
Subject:
Biology
Life Science
Physical Science
Physics
Material Type:
Activity/Lab
Provider:
Science Education Resource Center (SERC) at Carleton College
Provider Set:
Teach the Earth
Author:
Elizabeth Cochran
Date Added:
05/07/2021
Investigating Earthquakes: GIS Mapping and Analysis (College Level)
Conditional Remix & Share Permitted
CC BY-NC-SA
Rating
0.0 stars

This is a college-level adaptation of a chapter from the Earth Exploration Toolbook. The students download global quake data over a time range and use GIS to interpret the tectonic context.

(Note: this resource was added to OER Commons as part of a batch upload of over 2,200 records. If you notice an issue with the quality of the metadata, please let us know by using the 'report' button and we will flag it for consideration.)

Subject:
Biology
Geology
Life Science
Mathematics
Measurement and Data
Physical Science
Statistics and Probability
Material Type:
Activity/Lab
Data Set
Interactive
Provider:
Science Education Resource Center (SERC) at Carleton College
Provider Set:
Teach the Earth
Author:
Brian Welch
Date Added:
09/08/2020
Investigating Plate Tectonics with Google Earth
Conditional Remix & Share Permitted
CC BY-NC-SA
Rating
0.0 stars

Students examine data sets of topography, bathymetry, volcano location, earthquake location and size, and ocean floor age in Google Earth to determine the location and attributes of different types of plate tectonic boundaries. It helps them build their understanding of plate tectonics from data rather then from lecture.

(Note: this resource was added to OER Commons as part of a batch upload of over 2,200 records. If you notice an issue with the quality of the metadata, please let us know by using the 'report' button and we will flag it for consideration.)
Subject:
Biology
Life Science
Material Type:
Activity/Lab
Provider:
Science Education Resource Center (SERC) at Carleton College
Provider Set:
Teach the Earth
Author:
Beth Pratt-Sitaula
Date Added:
09/26/2022
Investigation of Newtonian Forces on Plate Tectonics
Conditional Remix & Share Permitted
CC BY-NC-SA
Rating
0.0 stars

This model-making activity gives students an opportunity visualize Newtonian forces acting on a single point as well as combined forces acting to produce synclines and anticlines in Earth's crust. Students will analyze models to interpret findings of plate movements.

Subject:
Geology
Physical Science
Physics
Material Type:
Activity/Lab
Provider:
Science Education Resource Center (SERC) at Carleton College
Provider Set:
Pedagogy in Action
Author:
Margy Schipper
Date Added:
08/10/2012
Is the New Madrid Seismic Zone at risk for a large earthquake?
Conditional Remix & Share Permitted
CC BY-NC-SA
Rating
0.0 stars

Students do background reading on the possible origins of intraplate seismicity and also read Nuttli's 1973 paper on the 1811-1812 New Madrid sequence. They construct frequency magnitude diagrams using data they acquire themselves from the openly archived University of Memphis catalog, Southern California Earthquake Center catalog, and USGS global catalog. They use these diagrams to estimate a recurrence interval for large magnitude earthquakes at the NMSZ. They then split into teams to read papers detailing campaign GPS surveys, paleoseismic measurements, and heat flow measurements. Each team is responsible for summarizing their set of papers for the other students. The culminating assignment is to update Gomberg and Schweig's 2002 USGS pamphlet "Earthquake hazard in the heart of the homeland" using scientific results that postdate the original pamphlet (including their own analysis). We also end with a "teaching and learning discussion" in which the students, who are usually high school teachers themselves, trade ideas about how they could repurpose parts of the lesson for use in their own classrooms. This activity gives students practice in data analysis and reading scientific papers, it shows them a few resources where they can find openly available data, and it gives them a chance to participate in the practice of science.
Teaching Tips
Adaptations that allow this activity to be successful in an online environment
This lesson was constructed specifically for an online course and didn't exist beforehand. I think it could work in a face-to-face course, too.
Elements of this activity that are most effective
Students,especially ones who are not as literate with software plotting / analysis programs, find the problem set somewhat difficult because the datasets are large and I am asking them to collect the data themselves, then use it to make a second-order plot and analyze that, instead of just plotting "A" vs. "B" and analyzing it.

That being said, I know that students are excited to be able to produce a plot themselves that exactly mimics one they can find in a published paper, and furthermore they are happy to find resources such as the USGS earthquake catalog that contain available real-time data.

The part where they have to compare and contrast the strengths and weaknesses of each technique used to study the NMSZ (seismology, paleoseismology, GPS, etc) is important because they get a real sense of how different approaches are important to resolve a scientific debate. I know they are learning something when they get frustrated because there isn't an easy answer!
Recommendations for other faculty adapting this activity to their own course:
-Be prepared to help students get through the technical aspects of some of the scientific papers, especially if they are not used to reading scientific papers. When I pick the papers for them to read, I purposely pick ones that aren't too long (Science, Nature, GRL, etc) and I try to pick ones that came with a press release, "news and views" or similar, and then I tell the students to read the press release first and then the paper.

-Be prepared to give students hints about counting and sorting data to make the frequency-magnitude diagrams because you'd rather lead them towards how to make the plots and then let them get on with the analysis as opposed to letting them get so frustrated with their lack of technical skills that they aren't interested in the science anymore. This exercise should be about seismology; it shouldn't be an excel tutorial! I have a little set of screen capture movie how-to hints under a hidden url, and when I can tell that a student is really suffering I reveal them.

(Note: this resource was added to OER Commons as part of a batch upload of over 2,200 records. If you notice an issue with the quality of the metadata, please let us know by using the 'report' button and we will flag it for consideration.)
Subject:
Biology
Life Science
Mathematics
Measurement and Data
Statistics and Probability
Material Type:
Activity/Lab
Provider:
Science Education Resource Center (SERC) at Carleton College
Provider Set:
Teach the Earth
Author:
Eliza Richardson
Date Added:
12/11/2020
Laboratory Analogs of Faults
Conditional Remix & Share Permitted
CC BY-NC-SA
Rating
0.0 stars

This activity utilizes a sandbox analog model which is used to create normal faults and a foreland propagating fold and thrust belt. For the normal fault portion of the activity, students investigate the progression of normal fault generation and accumulation of offset. During the thrust fault portion of the activity, students evaluate (1) the initiation angles of thrust faults, (2) compare that to the final angles to understand how fault angles rotate with progressive thrust propagation, and (3) they visualize how the critical slope angle is involved in the initiation of younger thrust faults. In addition, they conceptualize methods utilized to evaluate the magnitude of fault offset, and vertical and horizontal shortening.
This activity is motivated by and utilizes a sandbox model from:
Dell Castello, M., and Cooke, M., 2008, Watch faults grow before your very eyes in a deformational sandbox: Journal of Geoscience Education, v. 56, p. 324-333.
Tips for the activity: I place a sheet of sandpaper under the sand on one side of the compression experiment to test the outcomes with varying basal friction. For the extension portion, I attach separate metal sheets to the stationary wall and the moving wall, under the sand. These sheets are joined by elastic fabric. To save money, mix non-toxic paint powder into basic sand to get colored sand.

(Note: this resource was added to OER Commons as part of a batch upload of over 2,200 records. If you notice an issue with the quality of the metadata, please let us know by using the 'report' button and we will flag it for consideration.)
Subject:
Biology
Life Science
Mathematics
Measurement and Data
Statistics and Probability
Material Type:
Activity/Lab
Provider:
Science Education Resource Center (SERC) at Carleton College
Provider Set:
Teach the Earth
Author:
Jackie Langille
Date Added:
11/25/2019