
Published Books
- Subject:
- Physical Geography
- Material Type:
- Assessment
- Case Study
- Data Set
- Author:
- Jyotiram More
- Date Added:
- 05/30/2020

Published Books
This page provides resources related to Katie A. and the Katie A. Northern Collaborative, as well as useful information pertaining to collaborative learning and communities of practice.
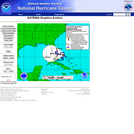
This page from the National Hurricane Center hosts a variety of still graphics that can be looped into animations of the storm's progress. Images include 3- and 5-day Watches and Warnings, Wind Swaths and Strike Probabilities.
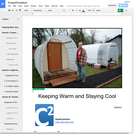
Consistent housing is a continual issue for our community, evidence of this is readily observable in the neighborhoods surrounding our classrooms. Over the course of 15 classroom hours, students will be exploring how they can insulate structures to protect from extreme hot and extreme cold using recycled and/or repurposed materials.
Students will make observations and collect data related to temperature. Student findings will be communicated through science journals, student generated models (charts, 3D structures, drawings, etc.).
This article, part of Biodiversity Counts, provides insight into keeping field journals. The article discusses why journals are so important both to scientists and to the museums and institutions that employ them and has tips for how to keep a field journal.
In the first part of this lab, students learn about land ice and the processes and timescales involved in glaciation. In Part B, they use an online interactive to explore how glaciers provide scientists with evidence for climate change. Finally, students use image processing software to measure how much area a real glacier has lost over time due to rising temperatures.
(Note: this resource was added to OER Commons as part of a batch upload of over 2,200 records. If you notice an issue with the quality of the metadata, please let us know by using the 'report' button and we will flag it for consideration.)
Students explore NOAA's official record of tropical storms and hurricanes, then work with the primary data and data products to identify the dates and aspects of the Atlantic hurricane season.
(Note: this resource was added to OER Commons as part of a batch upload of over 2,200 records. If you notice an issue with the quality of the metadata, please let us know by using the 'report' button and we will flag it for consideration.)
This lab activity introduces students to overfishing, using Georges Bank groundfish as a case study. In Part A, students learn about overfishing by examining trends in annual haddock landings and mortality in Georges Bank from 1969-2016. In Part B, they learn about what it means for a species to be overfished by examining trends in Georges Bank Atlantic cod recruitments and spawning biomass from 1978-2014. In Part C, students explore the issue of the still-collapsed cod stocks and the role ocean warming may play in the failure to for the stock to rebound.
(Note: this resource was added to OER Commons as part of a batch upload of over 2,200 records. If you notice an issue with the quality of the metadata, please let us know by using the 'report' button and we will flag it for consideration.)
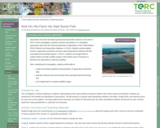
Aquaculture is the most rapidly growing food-production industry in the world. In Part A of this investigation, students examine and analyze U.S. and global aquaculture data from the Food and Agriculture Organization of the United Nations (FAO) Fisheries and Aquaculture database. In Part B, students examine global trends in aquaculture production and learn about aquaculture methods and their associated environmental impacts. In Part C, students use Google Earth to analyze before and after satellite images of the Pacific coast of Honduras to illustrate how aquaculture is altering coastlines.
(Note: this resource was added to OER Commons as part of a batch upload of over 2,200 records. If you notice an issue with the quality of the metadata, please let us know by using the 'report' button and we will flag it for consideration.)
Students graph the relationship between air pressure and wind speed in 2005's Hurricane Katrina and for the entire 2005 hurricane season. From their analyses, they come up with an estimate of the minimum air pressure that is likely to result in hurricane-force winds of 65 knots or higher.
(Note: this resource was added to OER Commons as part of a batch upload of over 2,200 records. If you notice an issue with the quality of the metadata, please let us know by using the 'report' button and we will flag it for consideration.)
Students explore issues related to the rapid intensification of hurricanes. They become familiar with the concepts of heat energy and the specific heat of water and interact with animations of sea surface temperature images to identify the Gulf Stream and the Loop Current. Students use NOAA View and Google Earth, free data-image tools, to explore visualizations of heat content in the Gulf of Mexico just before Hurricane Katrina. The examine a plotted path of Katrina as an overlay on these visualizations and observe changes in the heat content of Gulf waters as the hurricane passed over it.
(Note: this resource was added to OER Commons as part of a batch upload of over 2,200 records. If you notice an issue with the quality of the metadata, please let us know by using the 'report' button and we will flag it for consideration.)
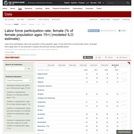
Data set and map pertaining to labor force participation rates for women in all countries. The World Bank specifies female labor force participation as a World Development Indicator (WDI) -- the statistical benchmark that helps measure the progress of development.
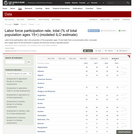
Data set and map pertaining to total labor force participation rates for all countries. The World Bank specifies labor force participation as a World Development Indicator (WDI) -- the statistical benchmark that helps measure the progress of development.
This is a worksheet (with sample answers for instructors) that was developed to help learners get a better understanding of the nuances related to the regulation of the Lac operon, and to provide them with opportunities to practice analytical thinking. We have used it for years in the biology component of a first year university science course (for science majors).
This page gives the biography of Langston Hughes an African American Poet, his career, political views and his representation in other media. It also provides the awards and honors received by Langston Hughes. Some of his poetry collections also provided here.
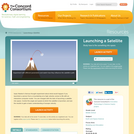
Isaac Newton's famous thought experiment about what would happen if you launched a cannon from a mountaintop at a high velocity comes to life with an interactive computer model. You are charged with the task of launching a satellite into space. Control the angle and speed at which the satellite is launched, and see the results to gain a basic understanding of escape velocity.

This is an activity about rockets. Learners will research facts about Atlas V rockets, which will launch the MMS satellites. After, they will compute the speed of the launch rocket, given a data chart of time vs. distance from lift-off. Then, they will write a report synthesizing their researched information. This lesson requires student access to internet accessible computers. This is lesson two as part of the MMS Mission Educator's Instructional Guide.
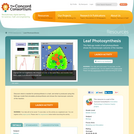
This NetLogo model of leaf photosynthesis shows the macroscopic outcome of the reaction.
These files contain a set of three Excel files to balance mineral reactions, to explore variation of thermodynamic properties as a function of P, T and composition and to explore stability of different mineral reactions using the popular thermodynamic databases of Berman and Holland and Powell. A set of instructions as well as some suggested exercises are included as Word files. This allows students with little knowledge of thermodynamics to explore stability quantitatively (e.g. to see what metastable and stable mean); students learning thermodynamics can see the workings of the databases from the "inside" and explore various properties including thermodynamic mixing behavior and non-ideality using simple models. The material can be used to accompany students from fairly introductory courses to advanced thermodynamics courses.
(Note: this resource was added to OER Commons as part of a batch upload of over 2,200 records. If you notice an issue with the quality of the metadata, please let us know by using the 'report' button and we will flag it for consideration.)

In this interview, Mark Siddall talks about his work as an invertebrate systematist and how marine organisms eat. Using a question and answer format, information is presented on the feeding habits, behaviors and strategies of various types of marine animals.