
This resource was created by the Washington Office of Superintendent of Public Instruction.
- Subject:
- Mathematics
- Material Type:
- Assessment
- Homework/Assignment
- Lesson
- Author:
- Hannah Hynes-Petty
- Date Added:
- 03/31/2020

This resource was created by the Washington Office of Superintendent of Public Instruction.

Using a Desmos activity, complete with videos, investigations, interactive graphs, etc. students explore inverses.
This lesson unit is intended to help teachers assess how well students are able to translate between graphs and algebraic representations of polynomials. In particular, this unit aims to help you identify and assist students who have difficulties in: recognizing the connection between the zeros of polynomials when suitable factorizations are available, and graphs of the functions defined by polynomials; and recognizing the connection between transformations of the graphs and transformations of the functions obtained by replacing f(x) by f(x + k), f(x) + k, -f(x), f(-x).
The PhET Activities Database is a collection of resources for using PhET sims. It includes hundreds of lesson plans, homework assignments, labs, clicker questions, and more. Some activities have been created by the PhET team and some have been created by teachers.
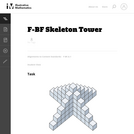
This problem is a quadratic function example. The other tasks in this set illustrate F.BF.1a in the context of linear (Kimi and Jordan), exponential (Rumors), and rational (Summer Intern) functions.
In this task students must figure out how much fresh water you must add to get a particular salt concentration in aquarium water.
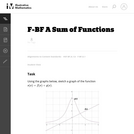
The intent of this problem is to have students think about how function addition works on a fundamental level, so formulas have been omitted on purpose.

This resource is geared for teacher use. It is loosely linked to the Secondary Math II, Mathematics Vision Project curriculum.

This resource is geared for teacher use. It is loosely linked to the Secondary Math II, Mathematics Vision Project curriculum.
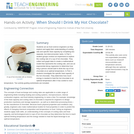
Students act as food science engineers as they explore and apply their understanding of cooling rate and specific heat capacity by completing two separate, but interconnected, tasks. In Part 1, student groups conduct an experiment to explore the cooling rate of a cup of hot chocolate. They collect and graph data to create a mathematical model that represents the cooling rate, and use an exponential decay regression to determine how long a person should wait to drink the cup of hot chocolate at an optimal temperature. In Part 2, students investigate the specific heat capacity of the hot chocolate. They determine how much energy is needed to heat the hot chocolate to an optimal temperature after it has cooled to room temperature. Two activity-guiding worksheets are included.