Updating search results...

Search Resources

131 Results

View
Selected filters:
  • statistics-and-probability
Boundless Statistics for Organizations
Conditional Remix & Share Permitted
CC BY-SA
Rating
0.0 stars

This book is used in Reach Higher, Oklahoma's adult degree completion program, for a course called Data Analysis & Interpretation. It provides basic statistics that can be used for organizational data analysis by individuals with managerial professional goals, while also teaching essential skills from Microsoft Excel commonly needed for data analysis. This book uses material from Lumen Learning's Boundless Statistics (Boundless Learning) and Excel for Decision Making from University of Houston Libraries (multiple authors).

Subject:
Applied Science
Business and Communication
Information Science
Mathematics
Statistics and Probability
Material Type:
Diagram/Illustration
Homework/Assignment
Textbook
Provider:
Online Consortium of Oklahoma
Author:
Brad Griffith
Lisa Friesen
Date Added:
10/14/2021
The Broken Stick Experiment: Triangles, Random Numbers and Probability
Conditional Remix & Share Permitted
CC BY-NC-SA
Rating
0.0 stars

This learning video is designed to develop critical thinking in students by encouraging them to work from basic principles to solve a puzzling mathematics problem that contains uncertainty. Materials for in-class activities include: a yard stick, a meter stick or a straight branch of a tree; a saw or equivalent to cut the stick; and a blackboard or equivalent. In this video lesson, during in-class sessions between video segments, students will learn among other things: 1) how to generate random numbers; 2) how to deal with probability; and 3) how to construct and draw portions of the X-Y plane that satisfy linear inequalities.

Subject:
Mathematics
Measurement and Data
Material Type:
Lecture
Provider:
MIT
Provider Set:
MIT Blossoms
Author:
Richard C. Larson
Date Added:
10/31/2014
Business Statistics
Unrestricted Use
CC BY
Rating
0.0 stars

Introductory survey of quantitative methods (QM), or the application of statistics in the workplace. Examines techniques for gathering, analyzing, and interpreting data in any number of fieldsĺÎĺ from anthropology to hedge fund management.

Subject:
Business and Communication
Management
Mathematics
Statistics and Probability
Material Type:
Activity/Lab
Full Course
Homework/Assignment
Reading
Syllabus
Provider:
The Saylor Foundation
Date Added:
11/10/2011
CTE Architecture: Storage Sheds
Conditional Remix & Share Permitted
CC BY-NC-SA
Rating
0.0 stars

This task was developed by high school and postsecondary mathematics and design/pre-construction educators, and validated by content experts in the Common Core State Standards in mathematics and the National Career Clusters Knowledge & Skills Statements. It was developed with the purpose of demonstrating how the Common Core and CTE Knowledge & Skills Statements can be integrated into classroom learning - and to provide classroom teachers with a truly authentic task for either mathematics or CTE courses.

Subject:
Applied Science
Architecture and Design
Geometry
Mathematics
Statistics and Probability
Material Type:
Activity/Lab
Assessment
Homework/Assignment
Lesson Plan
Provider:
National Association of State Directors of Career Technical Education Consortium
Provider Set:
Career Technical Education
Date Added:
03/05/2012
CTE Health Sciences: BMI Calculations
Conditional Remix & Share Permitted
CC BY-NC-SA
Rating
0.0 stars

This task was developed by high school and postsecondary mathematics and health sciences educators, and validated by content experts in the Common Core State Standards in mathematics and the National Career Clusters Knowledge & Skills Statements. It was developed with the purpose of demonstrating how the Common Core and CTE Knowledge & Skills Statements can be integrated into classroom learning - and to provide classroom teachers with a truly authentic task for either mathematics or CTE courses.

Subject:
Algebra
Applied Science
Health, Medicine and Nursing
Mathematics
Ratios and Proportions
Statistics and Probability
Material Type:
Activity/Lab
Lesson Plan
Provider:
National Association of State Directors of Career Technical Education Consortium
Provider Set:
Career Technical Education
Date Added:
07/27/2012
College Statistics
Conditional Remix & Share Permitted
CC BY-NC-SA
Rating
0.0 stars

Word Count: 236866

(Note: This resource's metadata has been created automatically by reformatting and/or combining the information that the author initially provided as part of a bulk import process.)

Subject:
Mathematics
Statistics and Probability
Material Type:
Textbook
Provider:
St. Clair College
Date Added:
07/01/2022
Concepts in Statistics
Conditional Remix & Share Permitted
CC BY-SA
Rating
0.0 stars

Word Count: 156850

(Note: This resource's metadata has been created automatically by reformatting and/or combining the information that the author initially provided as part of a bulk import process.)

Subject:
Mathematics
Statistics and Probability
Material Type:
Textbook
Provider:
City University of New York
Date Added:
03/30/2023
Criminal Justice Statistics
Conditional Remix & Share Permitted
CC BY-NC-SA
Rating
0.0 stars

A Lab Manual

Word Count: 2702

(Note: This resource's metadata has been created automatically by reformatting and/or combining the information that the author initially provided as part of a bulk import process.)

Subject:
Career and Technical Education
Criminal Justice
Mathematics
Statistics and Probability
Material Type:
Textbook
Author:
Elias Nader
Date Added:
12/24/2021
Curve Fitting
Unrestricted Use
CC BY
Rating
0.0 stars

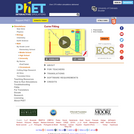
With your mouse, drag data points and their error bars, and watch the best-fit polynomial curve update instantly. You choose the type of fit: linear, quadratic, cubic, or quartic. The reduced chi-square statistic shows you when the fit is good. Or you can try to find the best fit by manually adjusting fit parameters.

Subject:
Mathematics
Material Type:
Simulation
Provider:
University of Colorado Boulder
Provider Set:
PhET Interactive Simulations
Author:
Michael Dubson
Trish Loeblein
Date Added:
08/01/2008
Curve Fitting (AR)
Unrestricted Use
CC BY
Rating
0.0 stars

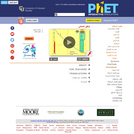
With your mouse, drag data points and their error bars, and watch the best-fit polynomial curve update instantly. You choose the type of fit: linear, quadratic, cubic, or quartic. The reduced chi-square statistic shows you when the fit is good. Or you can try to find the best fit by manually adjusting fit parameters.

Subject:
Mathematics
Material Type:
Simulation
Provider:
University of Colorado Boulder
Provider Set:
PhET Interactive Simulations
Author:
Michael Dubson
Patricia Loblein
Date Added:
08/02/2012
Data Analysis: Introduction to Measurement, Error, and Outliers
Conditional Remix & Share Permitted
CC BY-NC
Rating
0.0 stars

In this lesson, students measure and compare the rate of a falling object (a penny) at different heights to learn about statistical error.

Subject:
Mathematics
Material Type:
Lesson
Provider:
University of Colorado Boulder
Provider Set:
Cooperative Institute for Research in Environmental Sciences (CIRES)
Date Added:
01/01/2014
Data Analysis in the Psychological Sciences: A Practical, Applied, Multimedia Approach
Conditional Remix & Share Permitted
CC BY-NC-SA
Rating
0.0 stars

Short Description:
This open resources textbook contains 10 Units that describe and explain the main concepts in statistical analysis of psychological data. In addition to conceptual descriptions and explanations of the basic analyses for descriptive statistics, this textbook also explains how to conduct those analyses with common statistical software (Excel) and open-source free software (R).

Word Count: 27173

(Note: This resource's metadata has been created automatically by reformatting and/or combining the information that the author initially provided as part of a bulk import process.)

Subject:
Applied Science
Mathematics
Statistics and Probability
Material Type:
Textbook
Provider:
University of Iowa
Date Added:
01/16/2023
Data Analytics and Decision Making
Unrestricted Use
CC BY
Rating
0.0 stars

Short Description:
Data analytics is a rapidly evolving field. In today's labour market, knowing how to acquire, process, and interpret large amounts of data to make optimal decisions is crucial for many professionals, especially those in business and engineering. This open textbook, "a new online course" if you will, focuses on three key concept areas: data acquisition, data processing, and decision-making models. In this course, students will be able to develop advanced knowledge and skills to acquire related data for operations of business or projects; apply quantitative literacy skills such as statistics and machine learning; and use predictive or prescriptive modeling to make timely, actionable, and meaningful decisions.

Long Description:
Data analytics is a rapidly evolving field. In today’s labour market, knowing how to acquire, process, and interpret large amounts of data to make optimal decisions is crucial for many professionals, especially those in business and engineering. This open textbook, “a new online course” if you will, focuses on three key concept areas: data acquisition, data processing, and decision-making models. In this course, students will be able to develop advanced knowledge and skills to acquire related data for operations of business or projects; apply quantitative literacy skills such as statistics and machine learning; and use predictive or prescriptive modeling to make timely, actionable, and meaningful decisions.

Word Count: 2038

(Note: This resource's metadata has been created automatically by reformatting and/or combining the information that the author initially provided as part of a bulk import process.)

Subject:
Applied Science
Business and Communication
Computer Science
Engineering
Information Science
Management
Mathematics
Statistics and Probability
Material Type:
Textbook
Provider:
University of Windsor
Date Added:
02/28/2022
Decision Making Under Uncertainty: Introduction to Structured Expert Judgment
Conditional Remix & Share Permitted
CC BY-NC-SA
Rating
0.0 stars

In an increasingly data-driven world, data and its use aren’t always all it’s cracked up to be. This course aims to address the critical lack of any or appropriate data in many areas where complex decisions need to be made.

For instance, how can you predict volcano activity when no eruptions have been recorded over a long period of time? Or how can you predict how many people will be resistant to antibiotics in a country where there is no available data at national level? Or how about estimating the time needed to evacuate people in flood risk areas?

In situations like these, expert opinions are needed to address complex decision-making problems. This course, aimed at researchers and professionals from any academic background, will show you how expert opinion can be used for uncertainty quantification in a rigorous manner.

Various techniques are used in practice. They vary from the informal and undocumented opinion of one expert to a fully documented and formal elicitation of a panel of experts, whose uncertainty assessments can be aggregated to provide support for complex decision making.

In this course you will be introduced to state-of-the-art expert judgment methods, particularly the Classical Model (CM) or Cooke’s method, which is arguably the most rigorous method for performing Structured Expert Judgment.

CM, developed at TU Delft by Roger Cooke, has been successfully applied for over 30 years in areas as diverse as climate change, disaster management, epidemiology, public and global health, ecology, aeronautics/aerospace, nuclear safety, environment and ecology, engineering and many others.
Subject:
Applied Science
Engineering
Mathematics
Statistics and Probability
Material Type:
Full Course
Provider:
Delft University of Technology
Provider Set:
TU Delft OpenCourseWare
Author:
Dr. A.M. Hanea
Dr. ir. G.F. Nane
Prof. dr. R.M. Cooke
Date Added:
02/14/2020
Describing Distributions
Unrestricted Use
CC BY
Rating
0.0 stars

This is a task from the Illustrative Mathematics website that is one part of a complete illustration of the standard to which it is aligned. Each task has at least one solution and some commentary that addresses important aspects of the task and its potential use.

Subject:
Mathematics
Statistics and Probability
Material Type:
Activity/Lab
Provider:
Illustrative Mathematics
Provider Set:
Illustrative Mathematics
Author:
Illustrative Mathematics
Date Added:
08/06/2015
Describing Events
Unrestricted Use
CC BY
Rating
0.0 stars

This is a task from the Illustrative Mathematics website that is one part of a complete illustration of the standard to which it is aligned. Each task has at least one solution and some commentary that addresses important aspects of the task and its potential use.

Subject:
Mathematics
Statistics and Probability
Material Type:
Activity/Lab
Provider:
Illustrative Mathematics
Provider Set:
Illustrative Mathematics
Author:
Illustrative Mathematics
Date Added:
08/06/2015