
35 Results


Topics List for this Lesson: Sampling, Frequency Distributions, and GraphsMeasures of CenterMeasures of VarianceNormal Distributions and Problem SolvingZ-Scores and Unusual ValuesEmpirical Rule and Central Limit TheoremScatterplots, Correlation, and Regression
- Subject:
- Mathematics
- Material Type:
- Full Course
- Author:
- Jillian Miller
- Megan Simmons
- Stefanie Holmes
- Jessica Chambers
- Brad Fox
- Heather Doncaster
- Ashley Morgan
- Misty Anderson
- Date Added:
- 07/08/2021
You are probably asking yourself the question, "When and where will I use statistics?". If you read any newspaper or watch television, or use the Internet, you will see statistical information. There are statistics about crime, sports, education, politics, and real estate. Typically, when you read a newspaper article or watch a news program on television, you are given sample information. With this information, you may make a decision about the correctness of a statement, claim, or "fact." Statistical methods can help you make the "best educated guess."
- Subject:
- Mathematics
- Statistics and Probability
- Material Type:
- Textbook
- Provider:
- Rice University
- Provider Set:
- OpenStax CNX
- Author:
- Mihai Nica
- Date Added:
- 12/02/2019

Psychology is designed to meet scope and sequence requirements for the single-semester introduction to psychology course. The book offers a comprehensive treatment of core concepts, grounded in both classic studies and current and emerging research. The text also includes coverage of the DSM-5 in examinations of psychological disorders. Psychology incorporates discussions that reflect the diversity within the discipline, as well as the diversity of cultures and communities across the globe.Senior Contributing AuthorsRose M. Spielman, Formerly of Quinnipiac UniversityContributing AuthorsKathryn Dumper, Bainbridge State CollegeWilliam Jenkins, Mercer UniversityArlene Lacombe, Saint Joseph's UniversityMarilyn Lovett, Livingstone CollegeMarion Perlmutter, University of Michigan
- Subject:
- Psychology
- Social Science
- Material Type:
- Full Course
- Provider:
- Rice University
- Provider Set:
- OpenStax College
- Date Added:
- 02/14/2014

- Subject:
- Psychology
- Social Science
- Material Type:
- Unit of Study
- Provider:
- Rice University
- Provider Set:
- OpenStax College

By the end of this section, you will be able to:Explain what a correlation coefficient tells us about the relationship between variablesRecognize that correlation does not indicate a cause-and-effect relationship between variablesDiscuss our tendency to look for relationships between variables that do not really existExplain random sampling and assignment of participants into experimental and control groupsDiscuss how experimenter or participant bias could affect the results of an experimentIdentify independent and dependent variables
- Subject:
- Psychology
- Social Science
- Material Type:
- Module
- Date Added:
- 07/10/2017

This chapter covers:Why is Research Important?Approaches to ResearchAnalyzing FindingsEthicsFor more information, visit OpenStax College.
- Subject:
- Psychology
- Social Science
- Material Type:
- Module
- Date Added:
- 07/10/2017
By the end of this section, you will be able to:Explain what a correlation coefficient tells us about the relationship between variablesRecognize that correlation does not indicate a cause-and-effect relationship between variablesDiscuss our tendency to look for relationships between variables that do not really existRecognize how correlations coefficients tell us about the relationships between variables specific to selection methods.
- Subject:
- Psychology
- Social Science
- Material Type:
- Reading
- Author:
- Melanie Reed
- Date Added:
- 09/18/2020
Psychologists test research questions using a variety of methods. Most research relies on either correlations or experiments. With correlations, researchers measure variables as they naturally occur in people and compute the degree to which two variables go together. With experiments, researchers actively make changes in one variable and watch for changes in another variable. Experiments allow researchers to make causal inferences. Other types of methods include longitudinal and quasi-experimental designs. Many factors, including practical constraints, determine the type of methods researchers use. Often researchers survey people even though it would be better, but more expensive and time consuming, to track them longitudinally.
- Subject:
- Psychology
- Social Science
- Material Type:
- Module
- Provider:
- Diener Education Fund
- Provider Set:
- Noba
- Author:
- Christie Napa Scollon
- Date Added:
- 10/28/2022
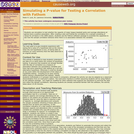
This activity has students use Fathom to test the correlation between attendance and ballpark capacity of major league baseball teams by taking a sample of actual data and scrambling one of the variables to see how the correlation behaves when the variables are not related. After displaying the distribution of correlations for many simulated samples, students find an approximate p-value based on the number of simulations that exceed the actual correlation.
- Subject:
- Mathematics
- Material Type:
- Activity/Lab
- Data Set
- Provider:
- Science Education Resource Center (SERC) at Carleton College
- Provider Set:
- Pedagogy in Action
- Author:
- Robin Lock
- Date Added:
- 11/06/2014
Students are introduced to the technology of flexible circuits, some applications and the photolithography fabrication process. They are challenged to determine if the fabrication process results in a change in the circuit dimensions since, as circuits get smaller and smaller (nano-circuits), this could become very problematic. The lesson prepares students to conduct the associated activity in which they perform statistical analysis (using Excel® and GeoGebra) to determine if the circuit dimension sizes before and after fabrication are in fact statistically different. A PowerPoint® presentation and post-quiz are provided. This lesson and its associated activity are suitable for use during the last six weeks of the AP Statistics course; see the topics and timing note for details.
- Subject:
- Mathematics
- Statistics and Probability
- Material Type:
- Lesson
- Provider:
- TeachEngineering
- Provider Set:
- TeachEngineering
- Author:
- Cunjiang Yu
- Miguel R. Ramirez
- Minwei Xu
- Song Chen
- Date Added:
- 02/17/2017

This course is a broad treatment of statistics, concentrating on specific statistical techniques used in science and industry. Topics include: hypothesis testing and estimation, confidence intervals, chi-square tests, nonparametric statistics, analysis of variance, regression, correlation, decision theory, and Bayesian statistics.
- Subject:
- Mathematics
- Material Type:
- Full Course
- Provider Set:
- MIT OpenCourseWare
- Author:
- Kempthorne, Peter
- Date Added:
- 02/01/2015

This course offers a broad treatment of statistics, concentrating on specific statistical techniques used in science and industry. Topics include: hypothesis testing and estimation, confidence intervals, chi-square tests, nonparametric statistics, analysis of variance, regression, and correlation.
OCW offers an earlier version of this course, from Fall 2003. This newer version focuses less on estimation theory and more on multiple linear regression models. In addition, a number of Matlab examples are included here.
- Subject:
- Mathematics
- Material Type:
- Full Course
- Provider Set:
- MIT OpenCourseWare
- Author:
- Panchenko, Dmitry
- Date Added:
- 09/01/2006

Provides students with the basic tools for analyzing experimental data, properly interpreting statistical reports in the literature, and reasoning under uncertain situations. Topics organized around three key theories: Probability, statistical, and the linear model. Probability theory covers axioms of probability, discrete and continuous probability models, law of large numbers, and the Central Limit Theorem. Statistical theory covers estimation, likelihood theory, Bayesian methods, bootstrap and other Monte Carlo methods, as well as hypothesis testing, confidence intervals, elementary design of experiments principles and goodness-of-fit. The linear model theory covers the simple regression model and the analysis of variance. Places equal emphasis on theory, data analyses, and simulation studies.
- Subject:
- Life Science
- Mathematics
- Material Type:
- Full Course
- Provider Set:
- MIT OpenCourseWare
- Author:
- Brown, Emery
- Date Added:
- 09/01/2016

Students examine graphical and tabular data to determine whether the evidence suggests that becomes CO² concentrations and temperature rise can be linked causally. The resource provides graphs and tabular data for student investigation and a student worksheet. This is an activity from Space Update, a collection of resources and activities provided to teach about Earth and space. Summary background information, data and images supporting the activity are available on the Earth Update data site.
- Subject:
- Atmospheric Science
- Geoscience
- Mathematics
- Physical Science
- Material Type:
- Activity/Lab
- Data Set
- Diagram/Illustration
- Provider:
- NASA
- Provider Set:
- NASA Wavelength
- Date Added:
- 11/05/2014